Any forecast can look good in hindsight. depower commits to its numbers before the market does.
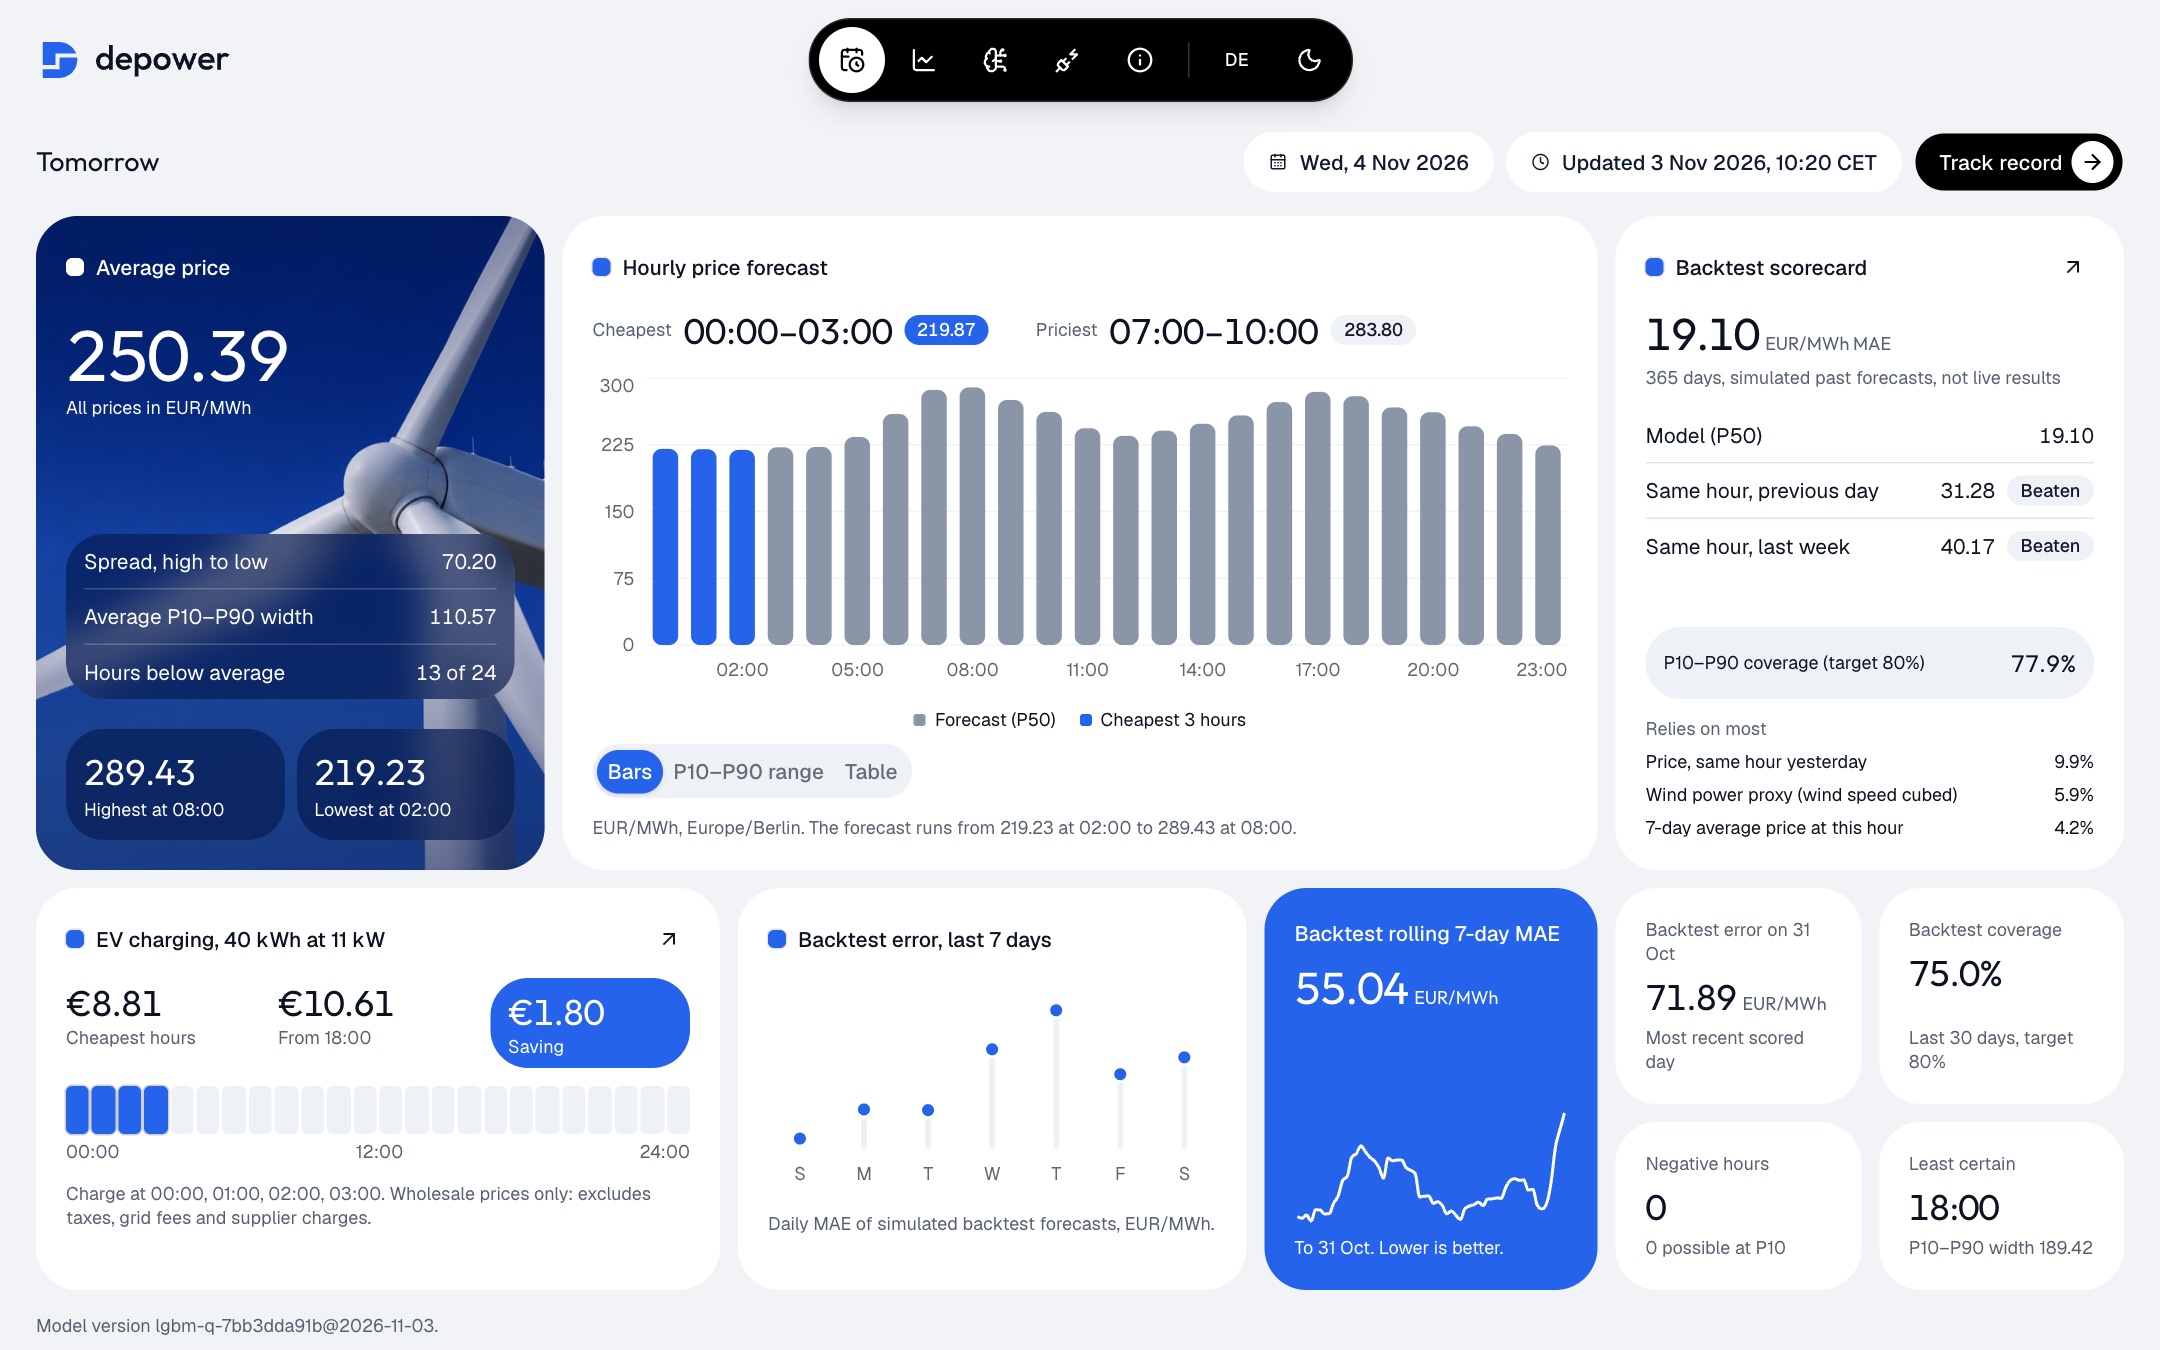
Germany’s wholesale electricity prices for each hour of tomorrow are set in an auction at 12:00 today. Every morning before that, depower forecasts all 24 prices with a likely range for each hour, using grid data from SMARD and ECMWF weather forecasts. Each forecast is logged once and can’t be overwritten. When the real prices are published, it gets scored in public. Live forecasts began on 3 November 2026, for delivery the next day.
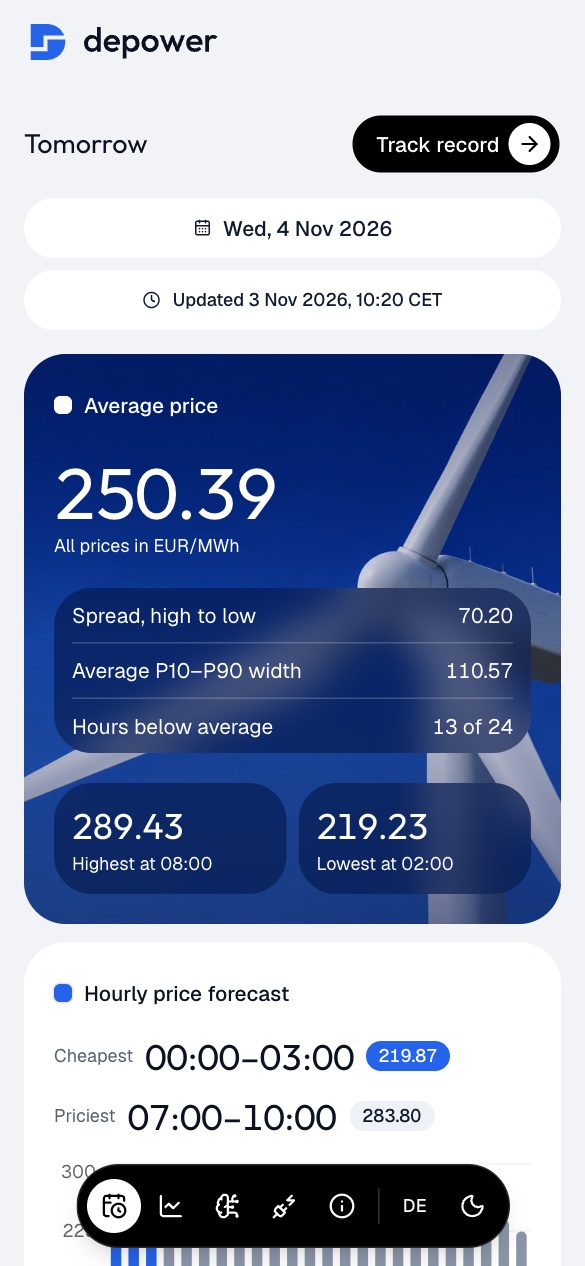
The first live forecast, made on 3 November 2026 for the next day, with the simulated backtest scorecard beside it.Challenge & solution
What made it hard, and how I approached it.
The challenge
A forecast is only honest if it uses what was known at the time
One value published after the auction is enough to make a backtest look better than the model could ever be live.
SMARD keeps no history of when values were published, and some forecast series only seem to appear after the auction closes.
A good error score proves little on its own. It needs simple baselines to beat, and a clear line between simulated and real results.
The solution
Make leaking hard, then publish the misses
Every cleaned row carries an available-at time, and features can only read through a view that hides anything newer than the 11:30 cutoff.
Tests overwrite post-cutoff values with absurd numbers and confirm no feature changes. An audit of all 23,136 real feature rows found none past its cutoff.
Each log entry stores the hash of the one before and CI fails if a forecast changes. The dashboard shows backtest and live results separately.
Key features
Built around what people actually need.
Tomorrow’s prices
24 hourly forecasts with P10–P90 ranges and the cheapest and priciest windows, as bars, ranges or a table.
Public track record
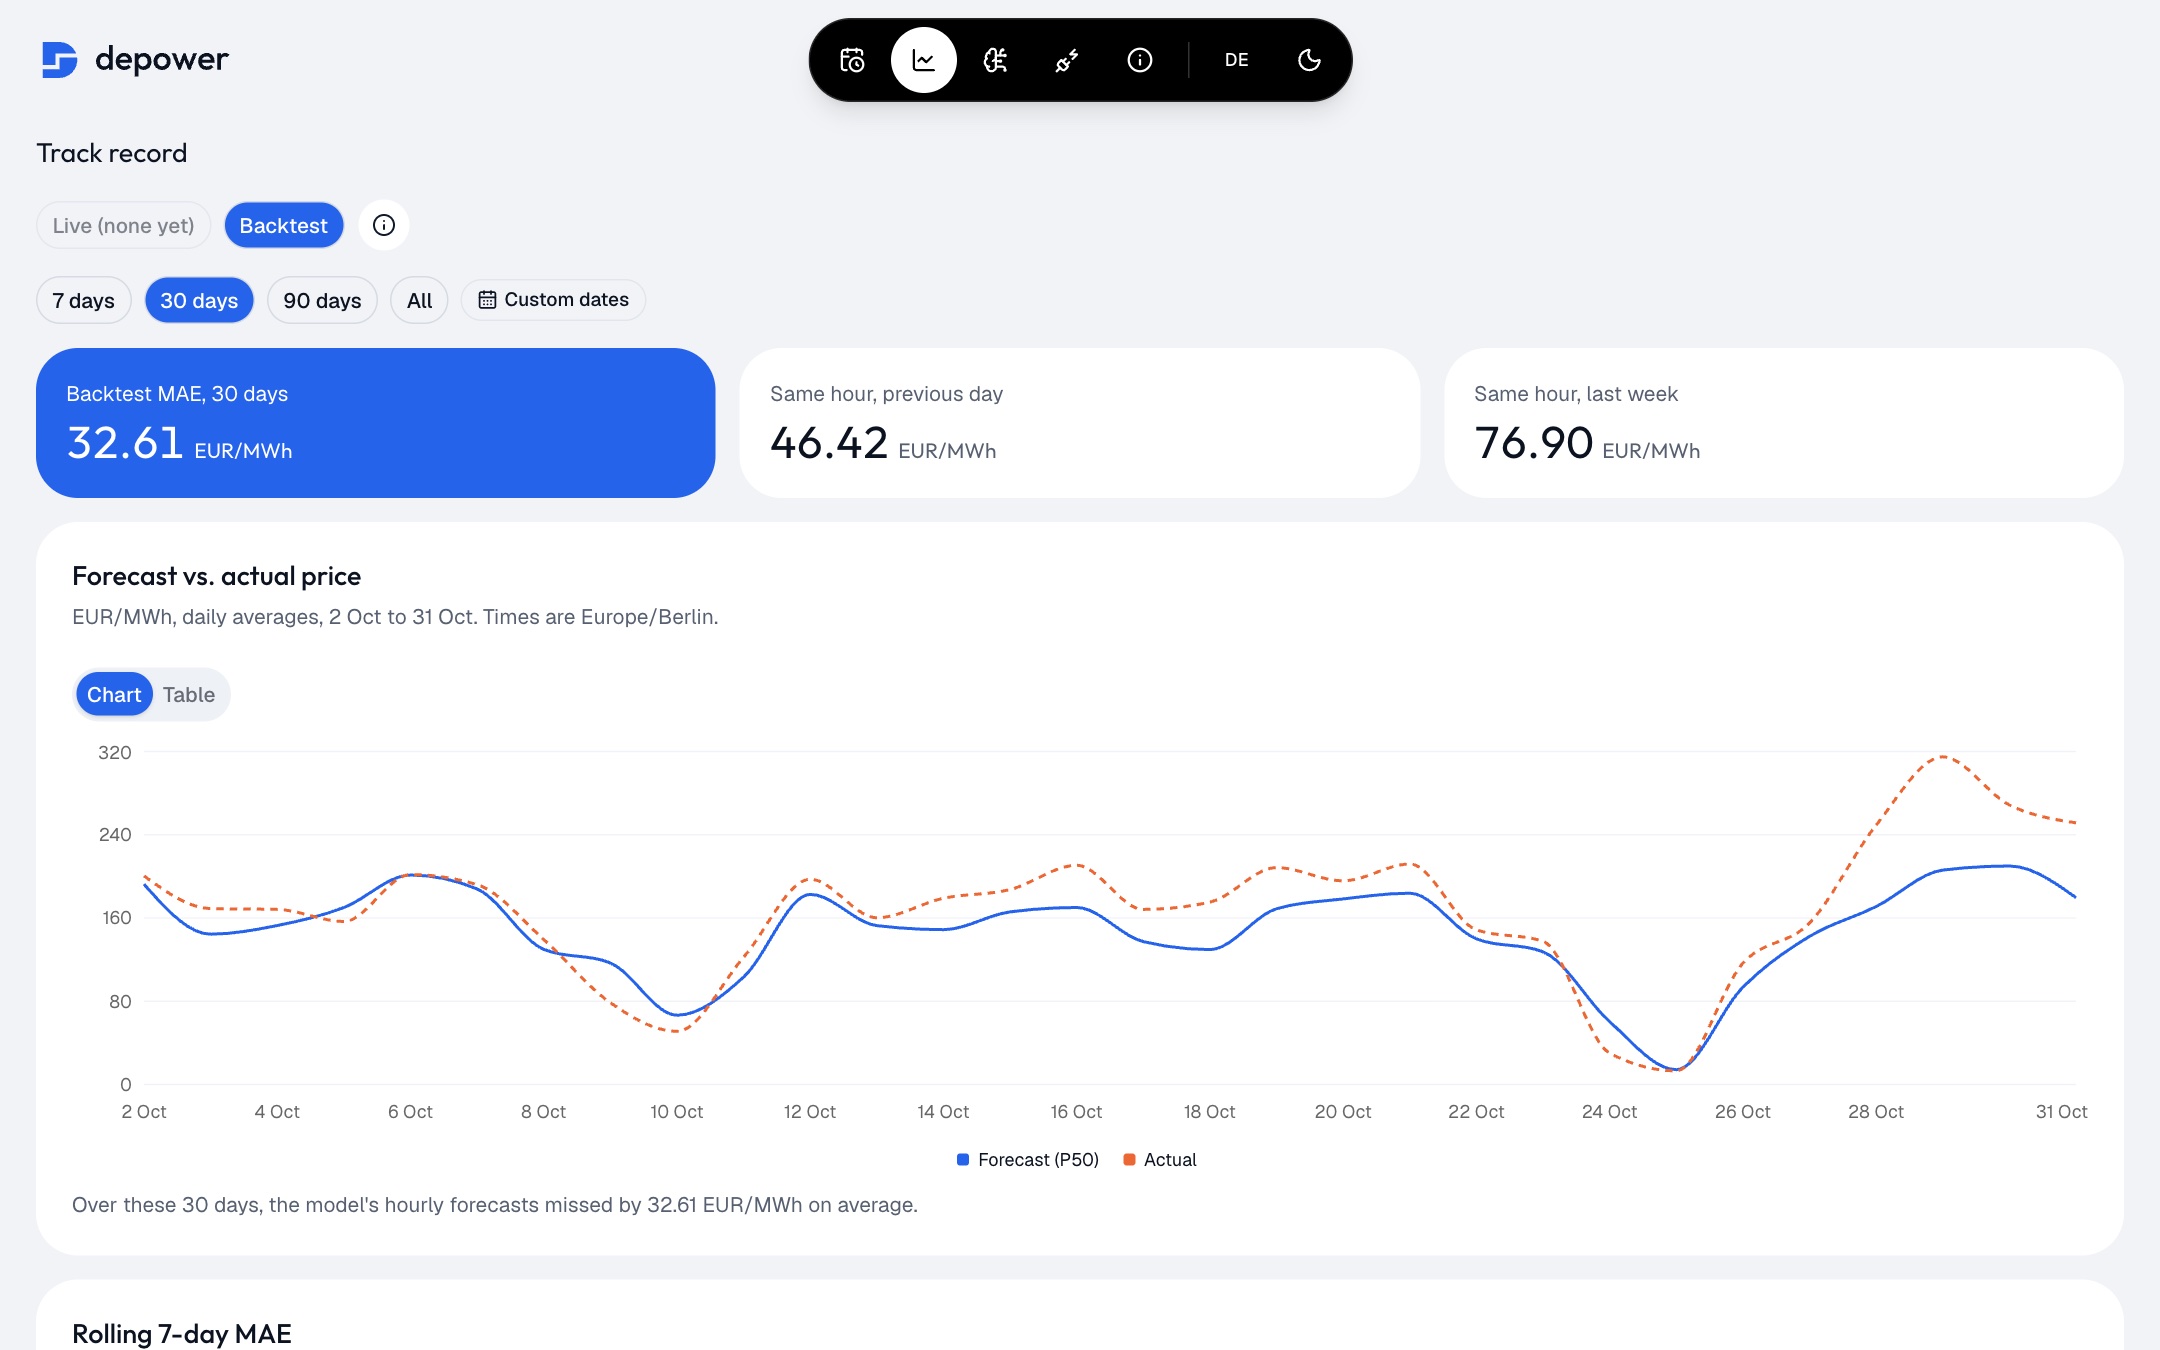
Forecasts scored against published prices and two simple baselines, with live and backtest results kept apart.
EV charging calculator
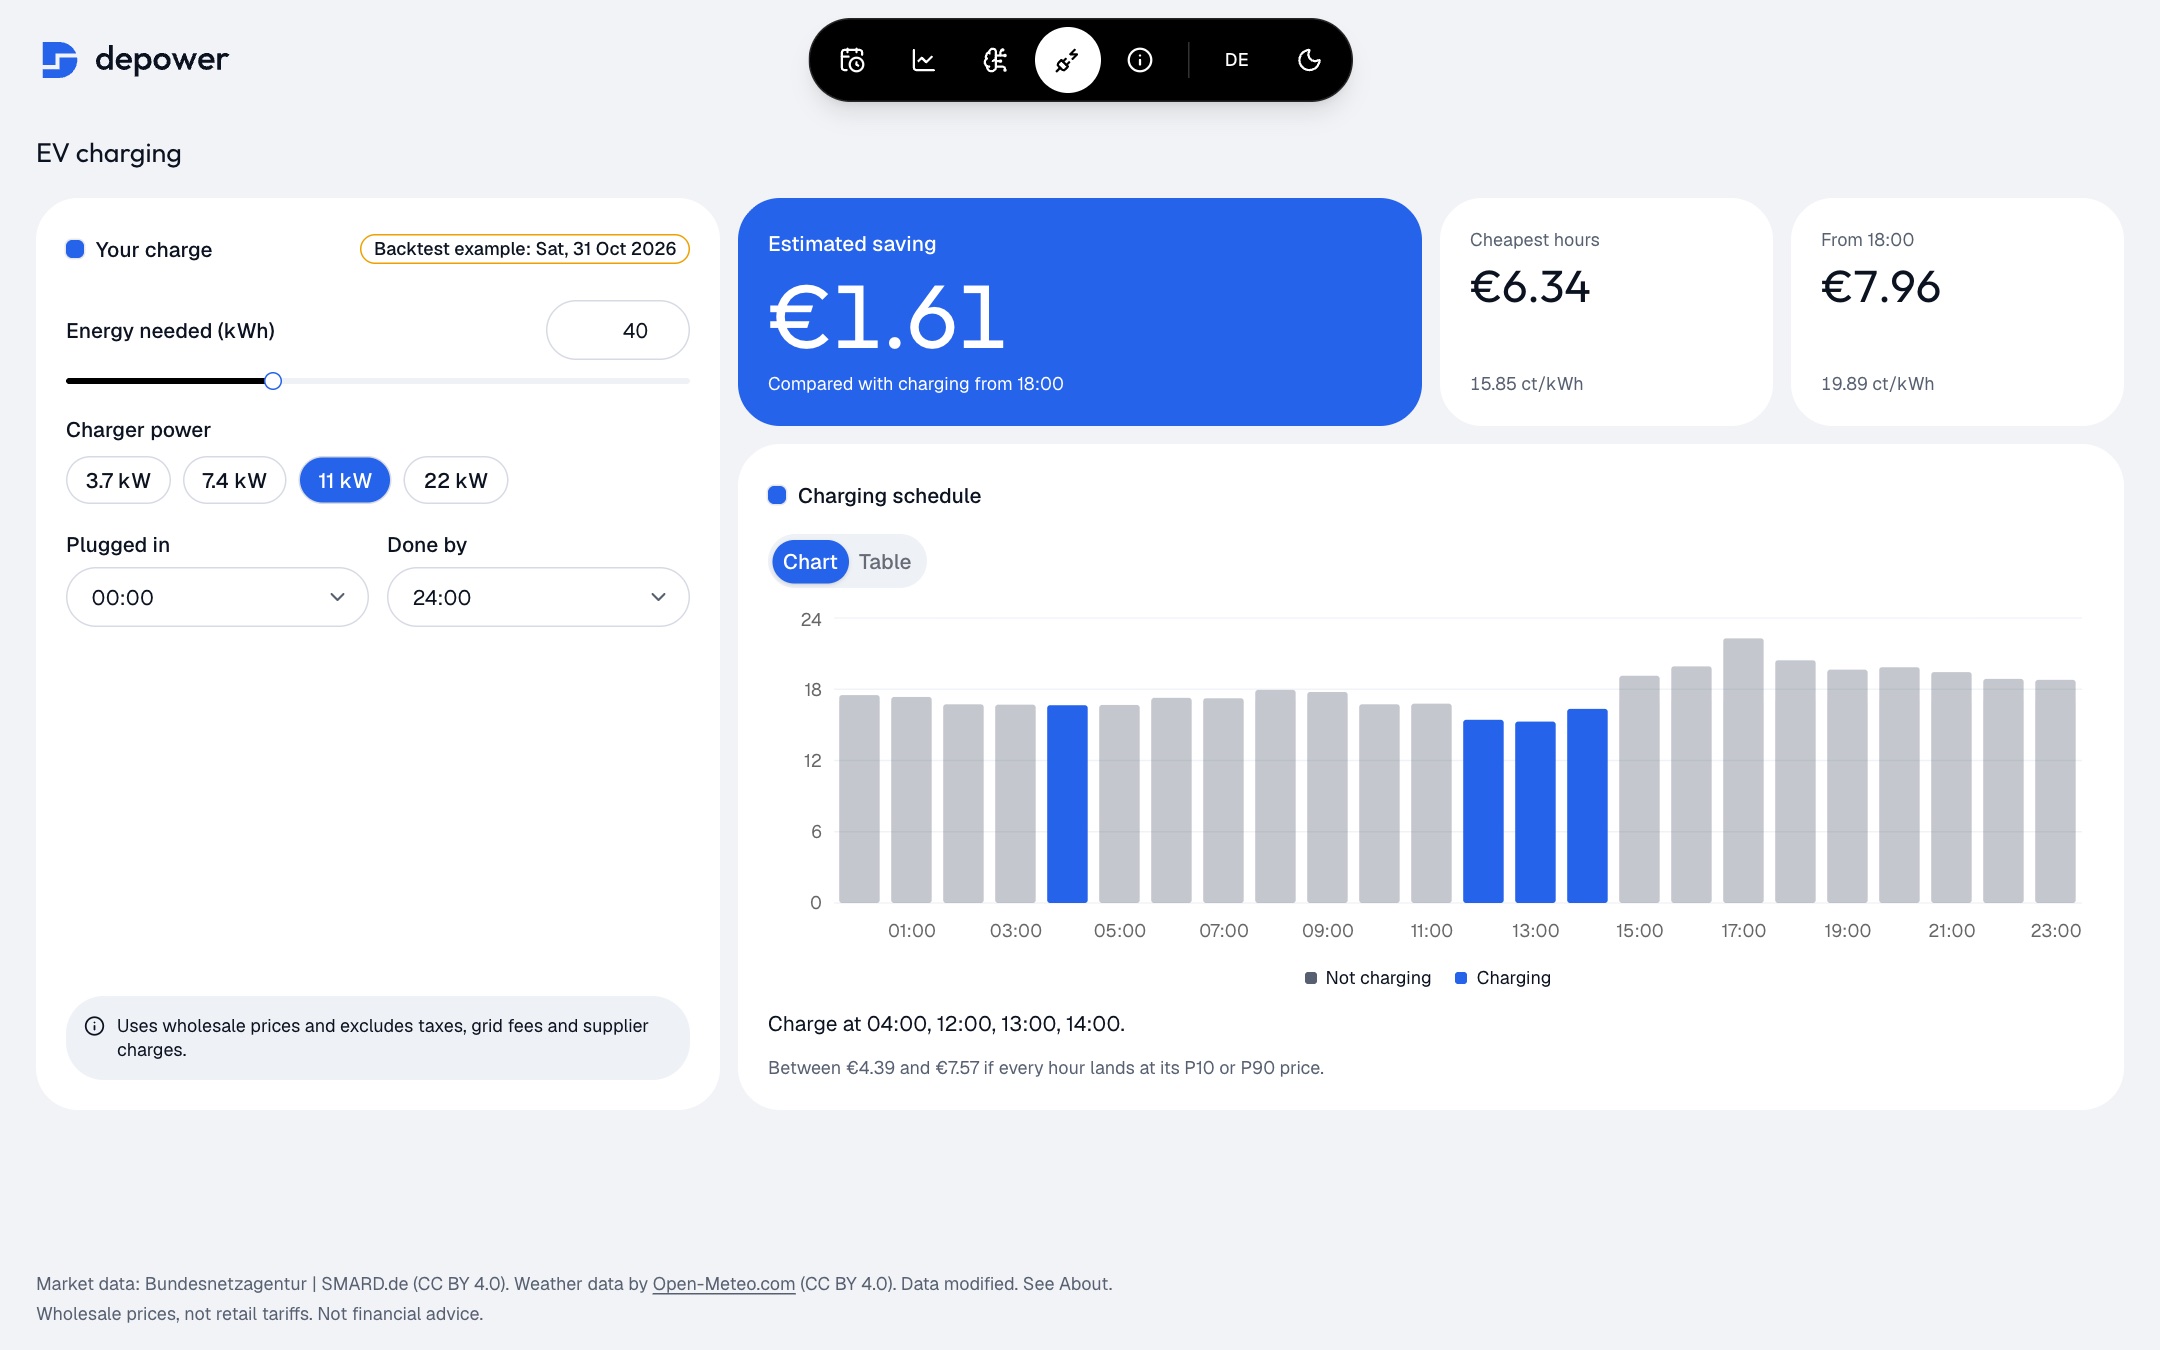
Finds the cheapest hours to charge within your plug-in window and estimates the saving, on wholesale prices only.
Responsive
Built for any screen
The dashboard folds into a single column on a phone, with every view one tap away.
Cards stack into one readable column
Navigation moves to a bar at the bottom of the screen
English and German, following the browser’s language
In the data
The backtest, including where it falls short.
Every number here comes from the project’s published report: 365 days from 1 November 2025 to 31 October 2026, with the model retrained monthly on earlier data only. These are simulated forecasts, not live results. Hover or tap for exact values.
Leakage rules
What the model may see at 11:30, half an hour before the auction.
Each bar is the time span an input can contribute. A bar only crosses the cutoff if those values were already published by then. Hover or tap a row to see why.
Source: german-day-ahead-forecast, leakage rules in the README. Bars start at the chart’s edge; history reaches further back.
Error by hour
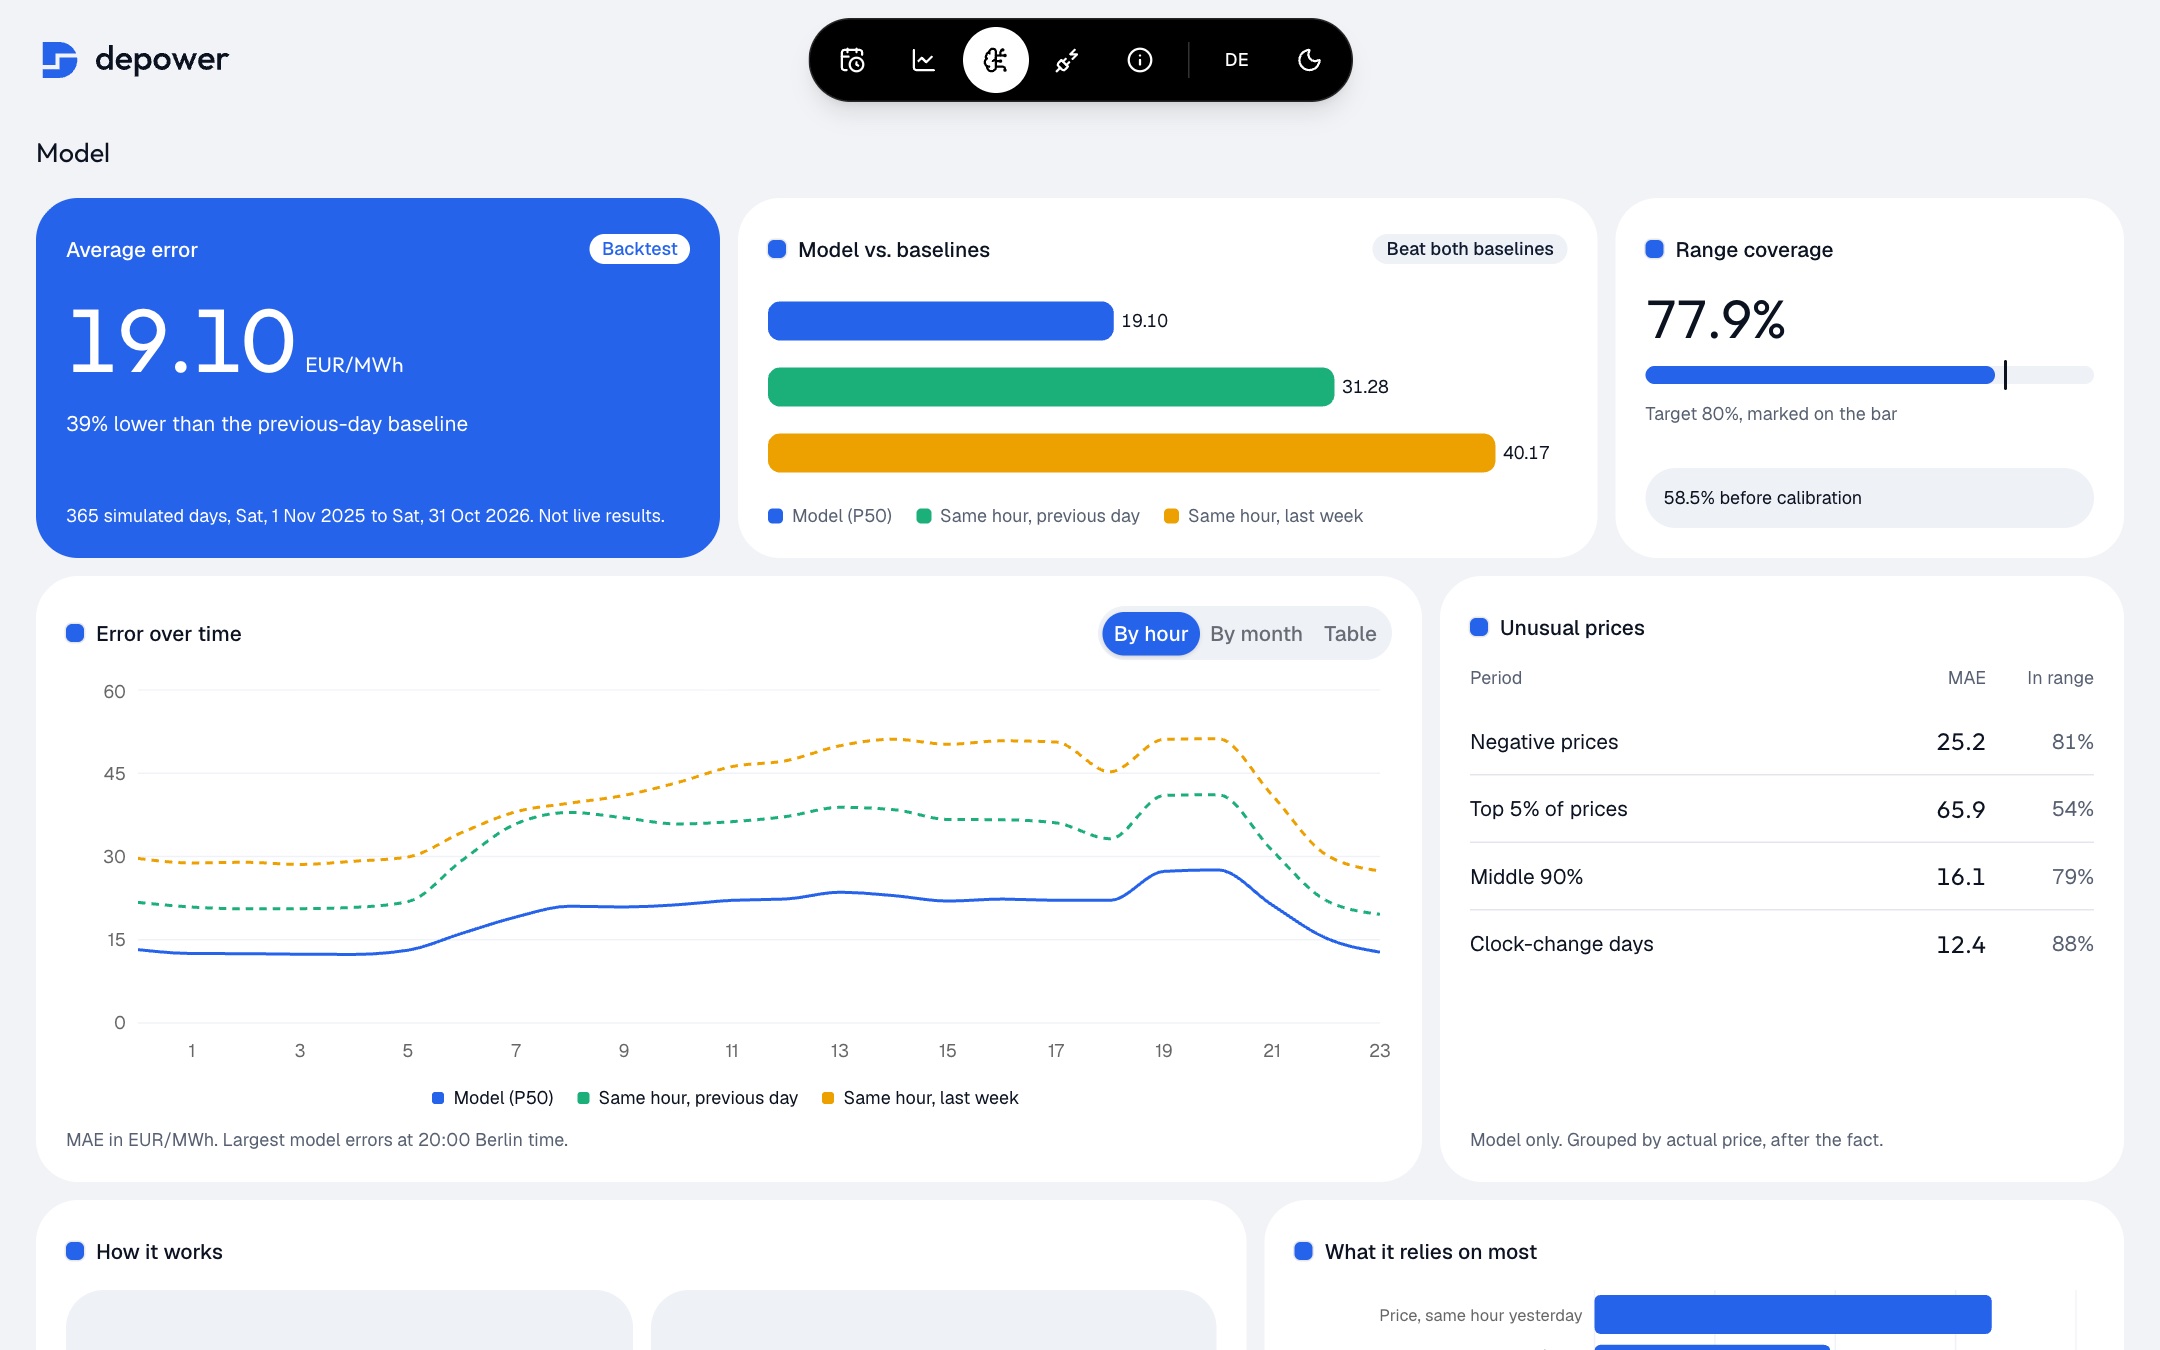
It beats both baselines at every hour. The evening peak is still its hardest.
Mean absolute error (MAE) by Berlin hour. Overall, the model misses by 19.10 EUR/MWh, against 31.28 for repeating yesterday’s price and 40.17 for repeating last week’s. Click a name to hide it.
September and October 2026 were its weakest months by far.
MAE was 31.8 and 32.6 EUR/MWh, against 11.3 to 20.1 in every other month. Switch views to see how often real prices landed inside the P10–P90 range.
Source: data/backtest/report.json, by_month.
Unusual prices
Price spikes are the main weakness.
In the highest 5% of prices, the model only narrowly beats yesterday’s price, and its range misses nearly half of those hours. Periods are grouped by actual price, after the fact.
Source: data/backtest/report.json, by_regime. Top 5% means at or above 215.72 EUR/MWh.
Screens
A closer look at the product.
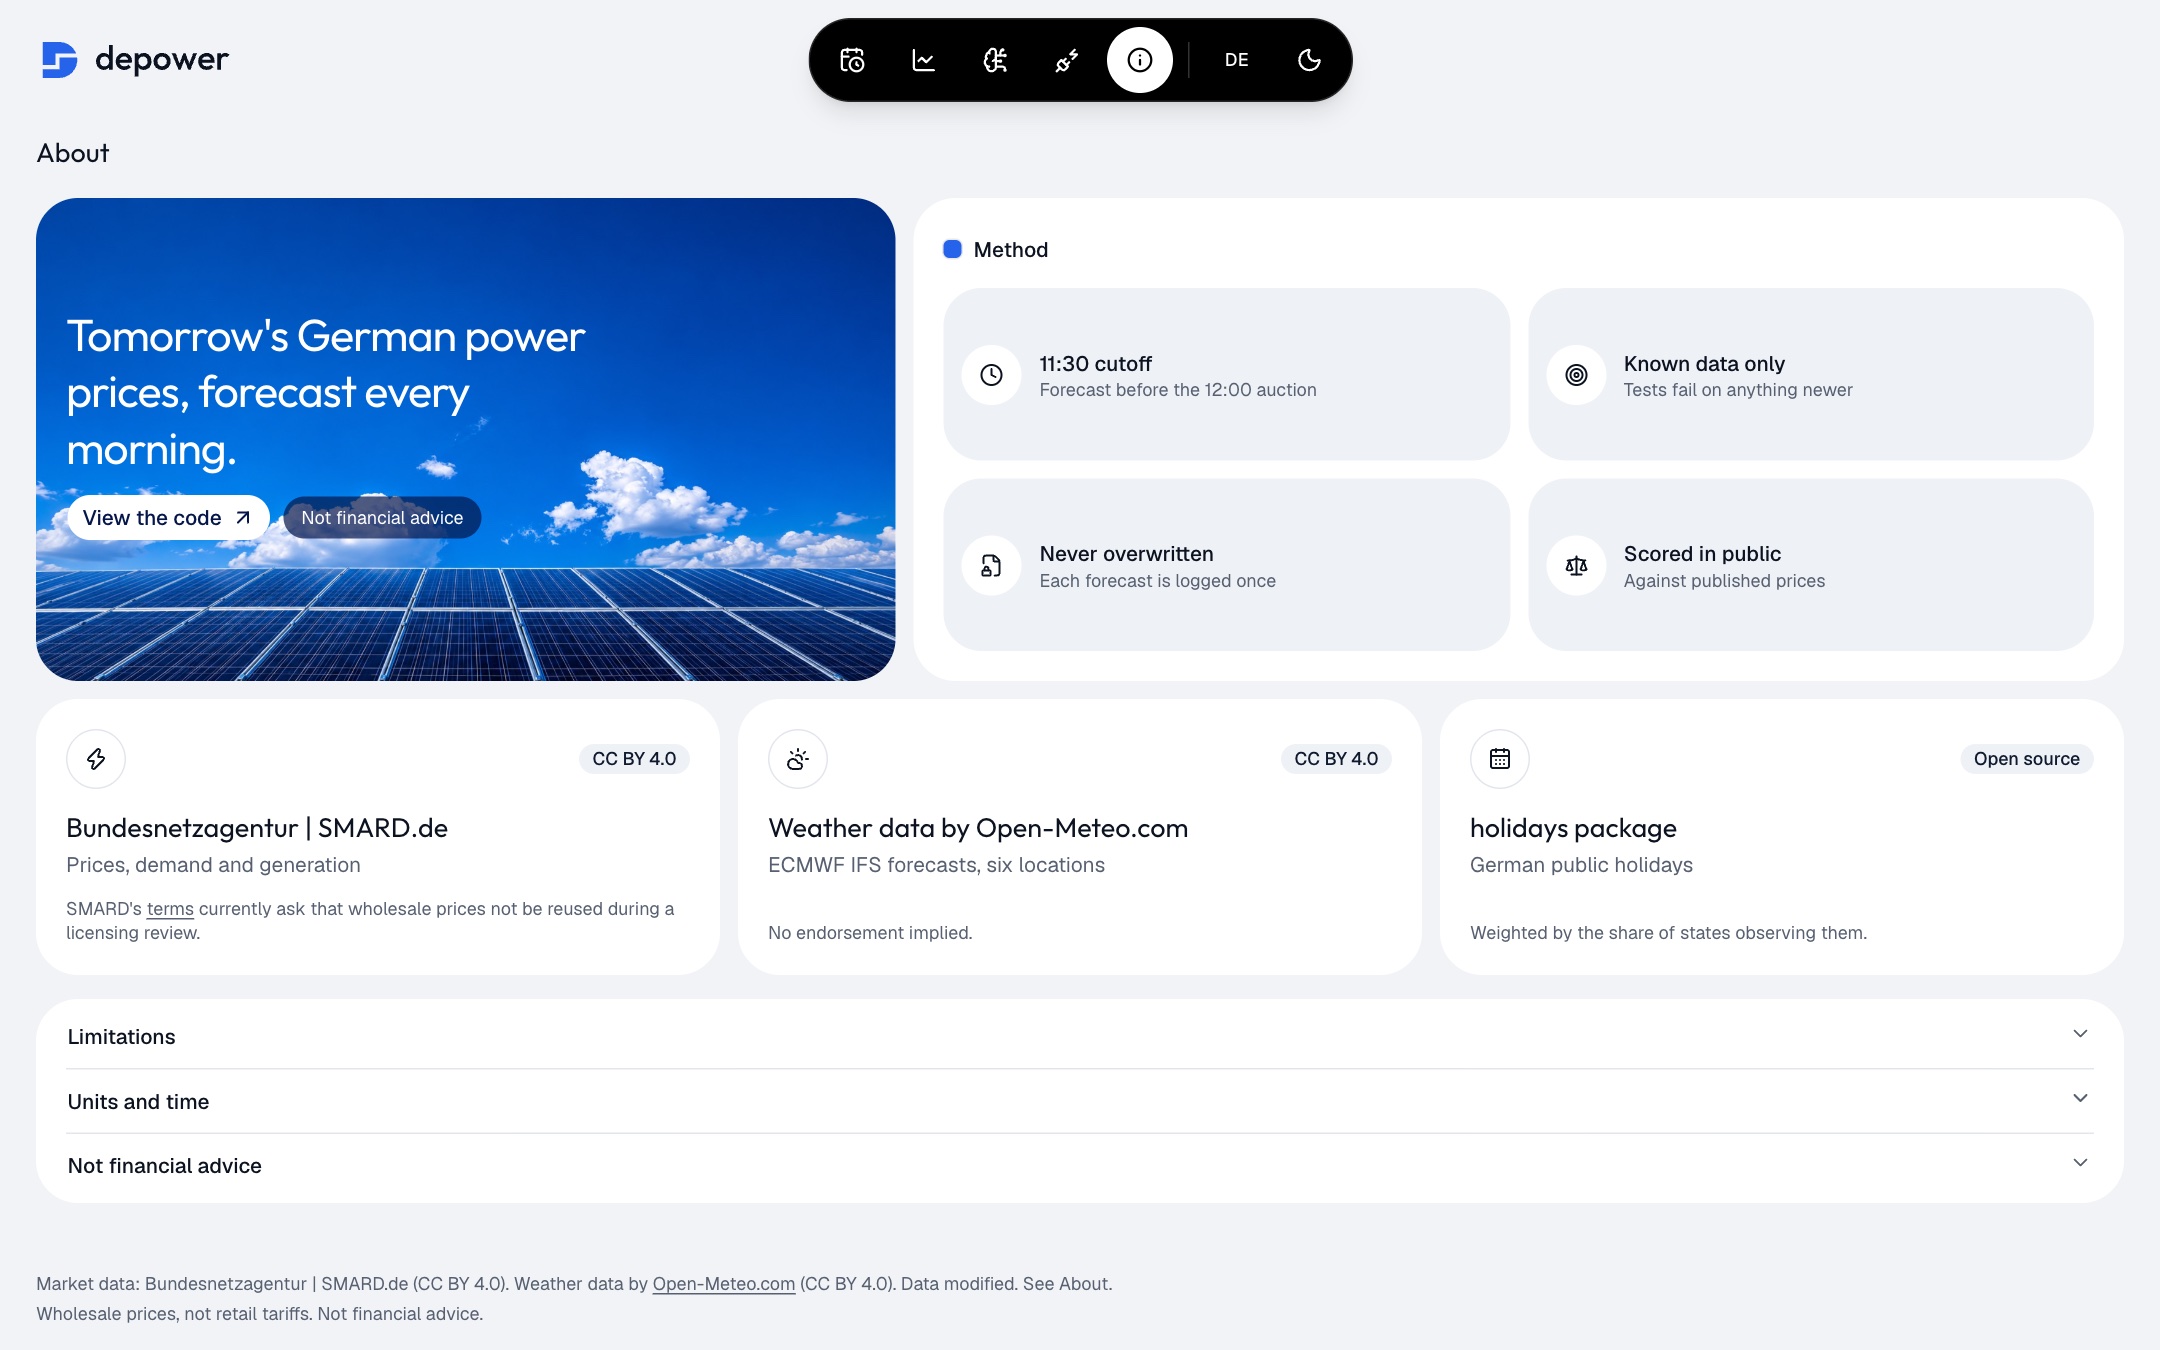
EV charging: pick the energy, charger and plug-in window to see the cheapest hoursAbout: the method, data sources and licences, with limitations spelled outTrack record: forecast against actual price, with no live results claimed until they existModel: error against the baselines, range coverage and unusual price periods
How it works
Under the hood.
DataSMARD (Bundesnetzagentur) for prices, demand and generation, Open-Meteo for ECMWF weather at six locations, and an offline holidays package.
ModelLightGBM quantile regression for P10, P50 and P90 on 72 features, retrained monthly in the backtest, with conformal calibration by hour.
PipelinePython and DuckDB. Raw responses are versioned, quality checks gate every forecast, and a late or incomplete run publishes nothing.
FrontendNext.js static export with shadcn/ui and Recharts, in English and German.
DeploymentDocker containers on a Hetzner server, run by systemd timers at 10:20, 10:45 and 11:10 Berlin time. GitHub Actions runs CI.
My first backtest’s P10–P90 ranges covered only 58.5% of real prices when they should have covered 80%. Calibration brought that to 77.9%, but I chose that fix after seeing the result, so the number may be slightly flattering, and the project says so. That taught me a forecast earns trust less through its error score than by showing what it could see, where it fails and what a simple baseline would have done.
 ← All projects