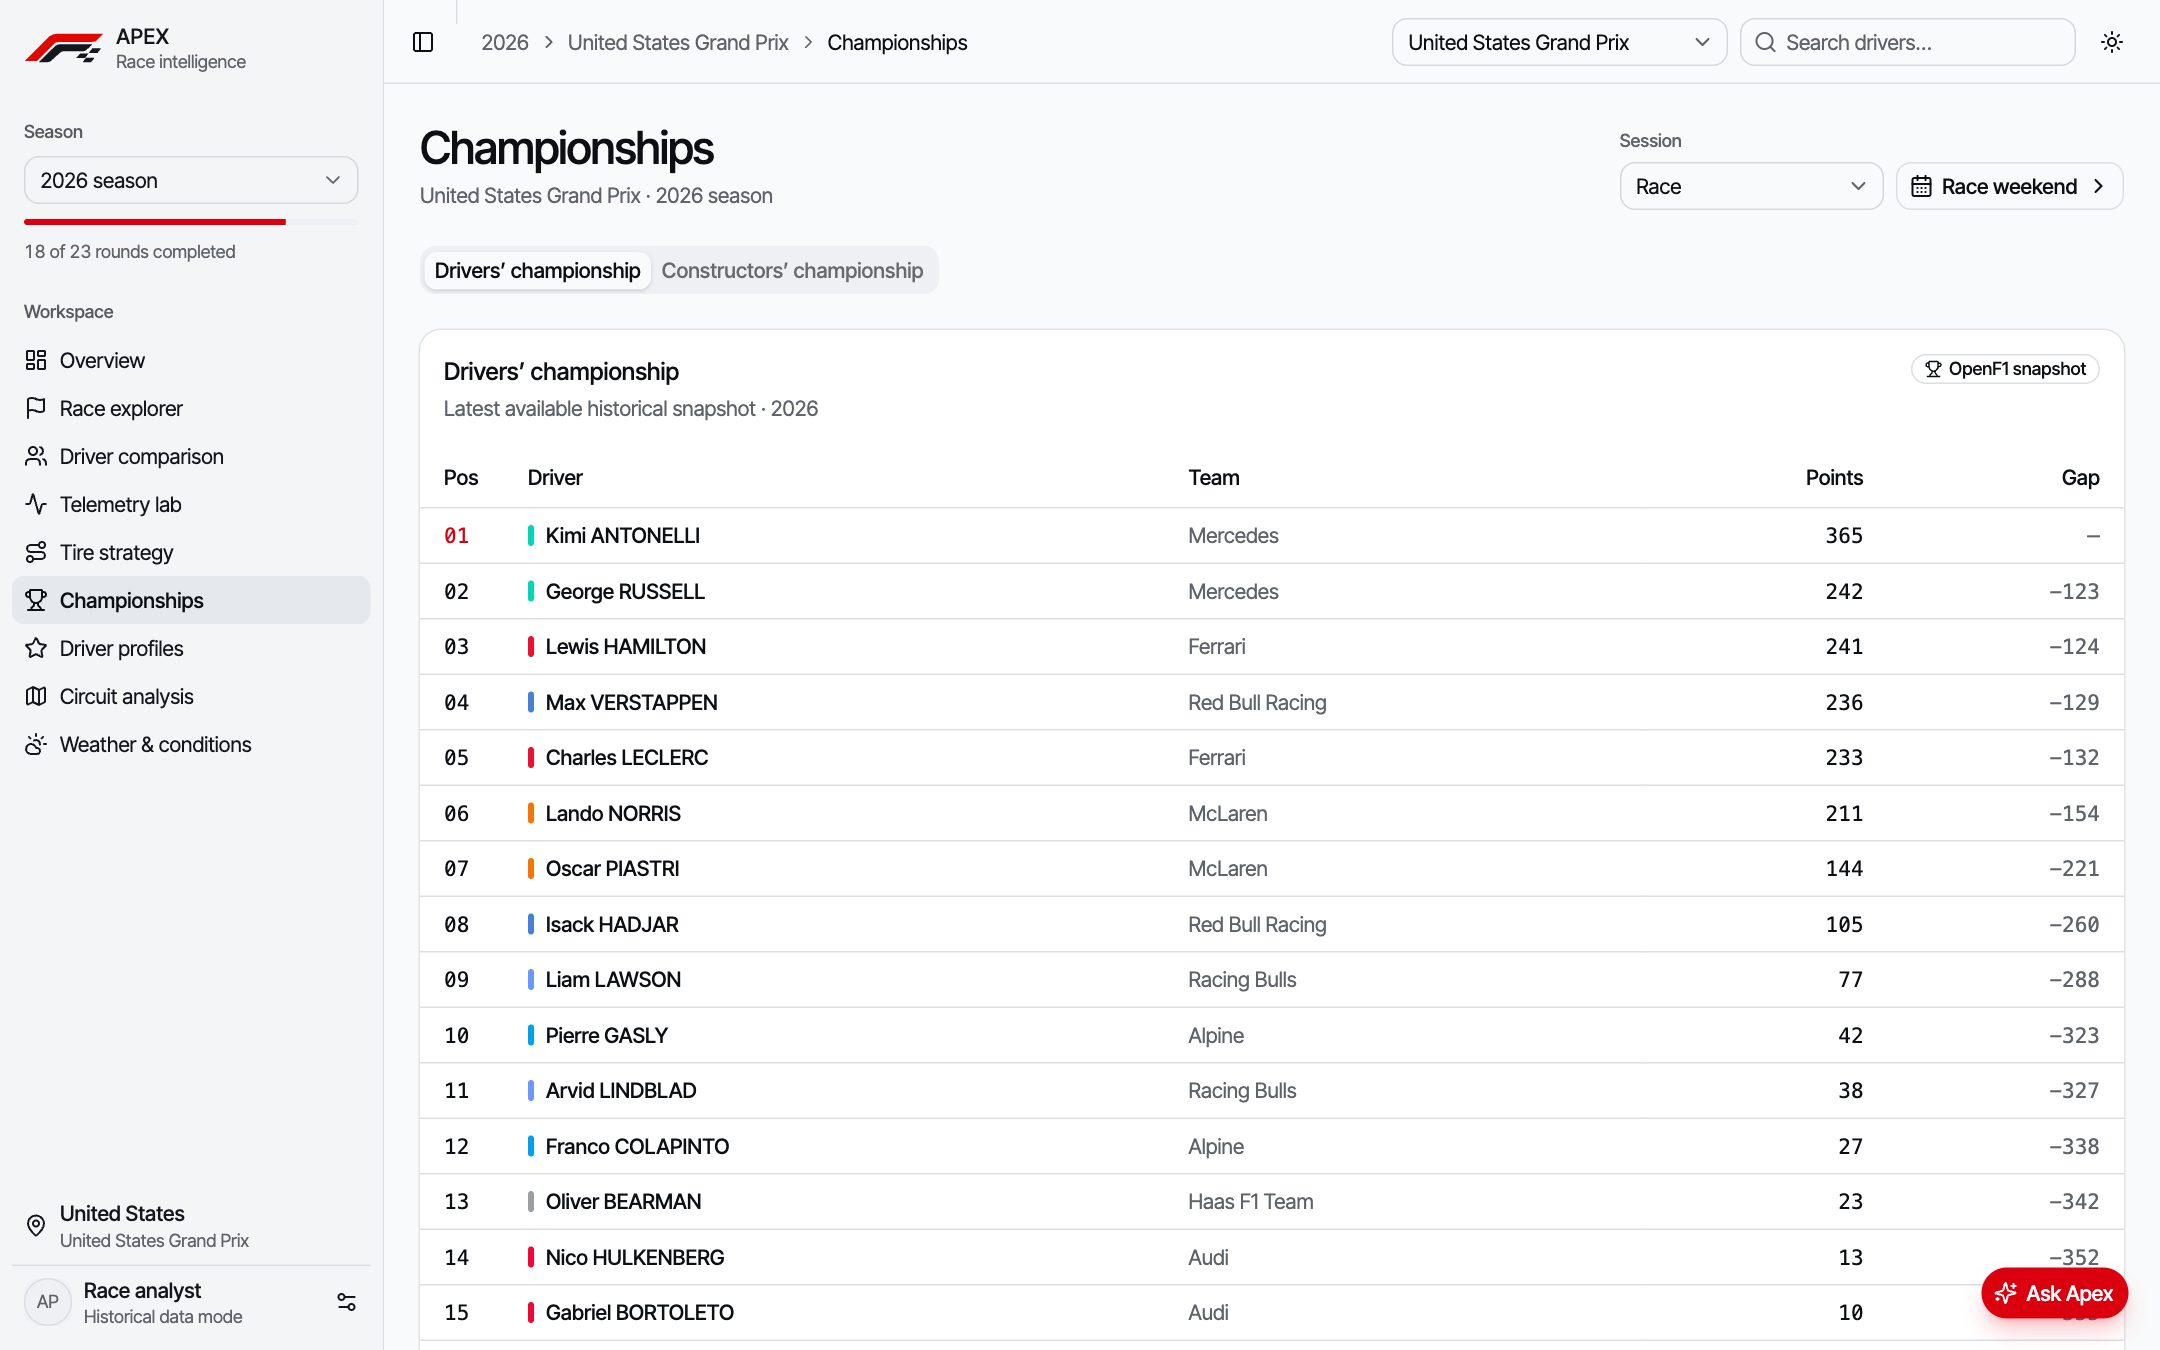
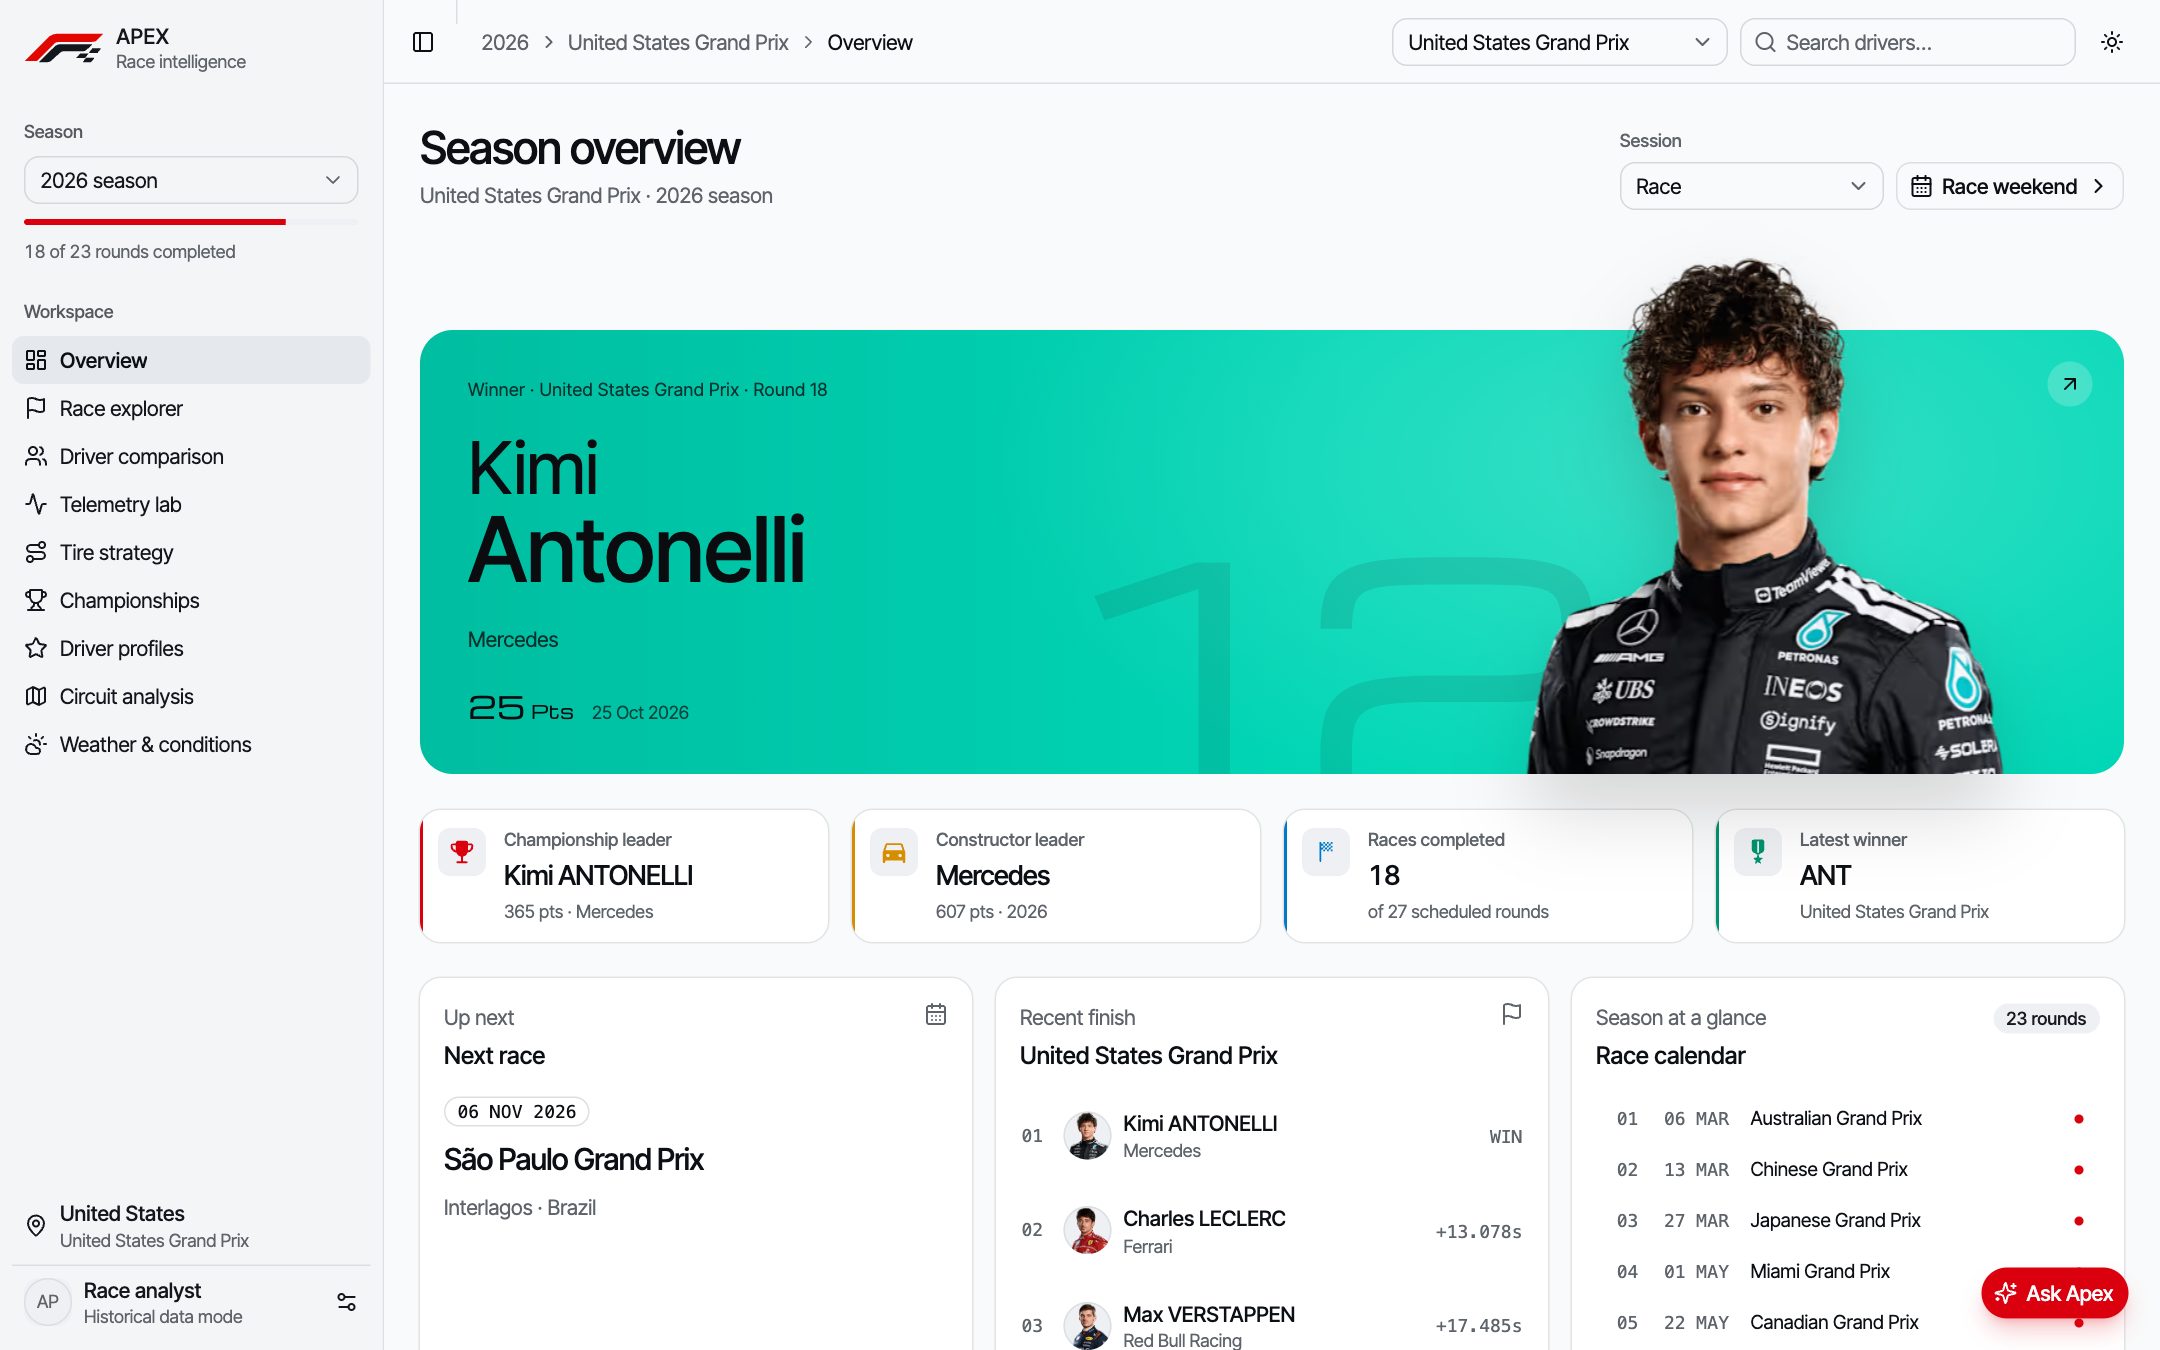
F1 produces huge amounts of data. APEX turns a season of it into something you can actually read.
OpenF1 publishes timing, positions, laps, stints and telemetry for every session since 2023 — but as raw API responses. APEX is a dashboard that turns that into season overviews, race replays, head-to-head driver comparisons, tire strategy charts and championship tables, with no account or paid API needed.
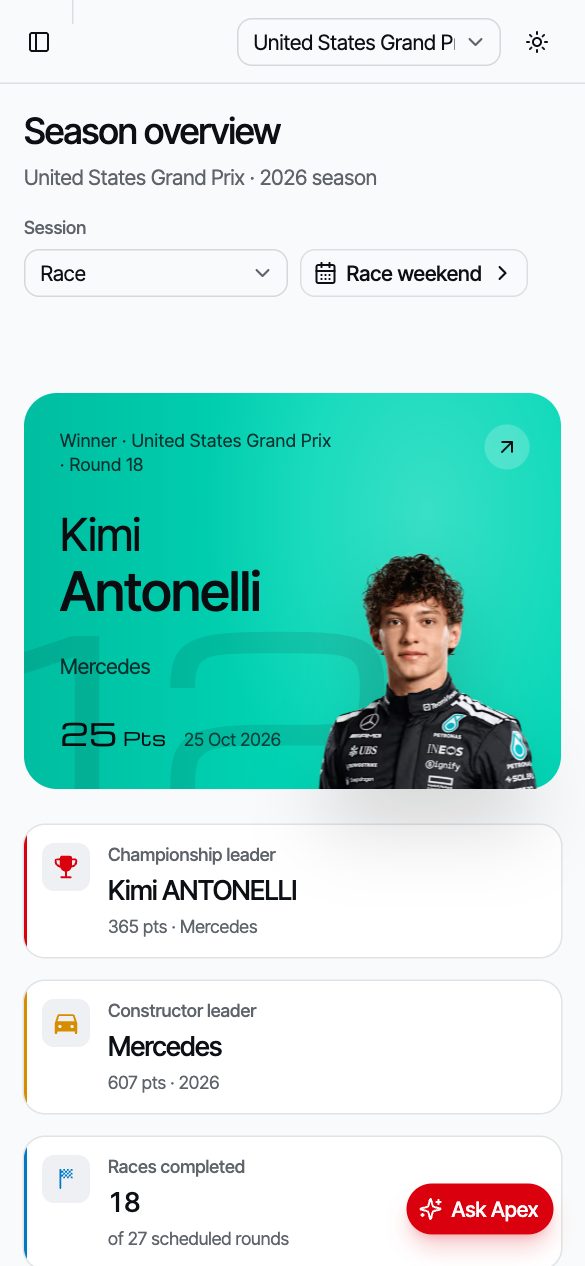
Season overview — race winner, championship leaders and the full calendar at a glance.Challenge & solution
What made it hard, and how I approached it.
The challenge
Raw, heavy and inconsistent data
Telemetry for a single session can run to hundreds of thousands of points per driver.
Standings, positions and weather arrive as separate endpoints with gaps and missing snapshots.
An AI assistant needed to be useful without exposing API keys or running up costs.
The solution
Fetch less, cache more, explain clearly
Telemetry loads two drivers for a five-minute window at a time, filtered at the API and downsampled before charting.
Requests are cached and cancelled when abandoned (TanStack Query); selections live in the URL so views are shareable.
Ask Apex runs server-side behind GitHub sign-in, with a daily per-user question limit stored in SQLite.
Key features
Built around what people actually need.
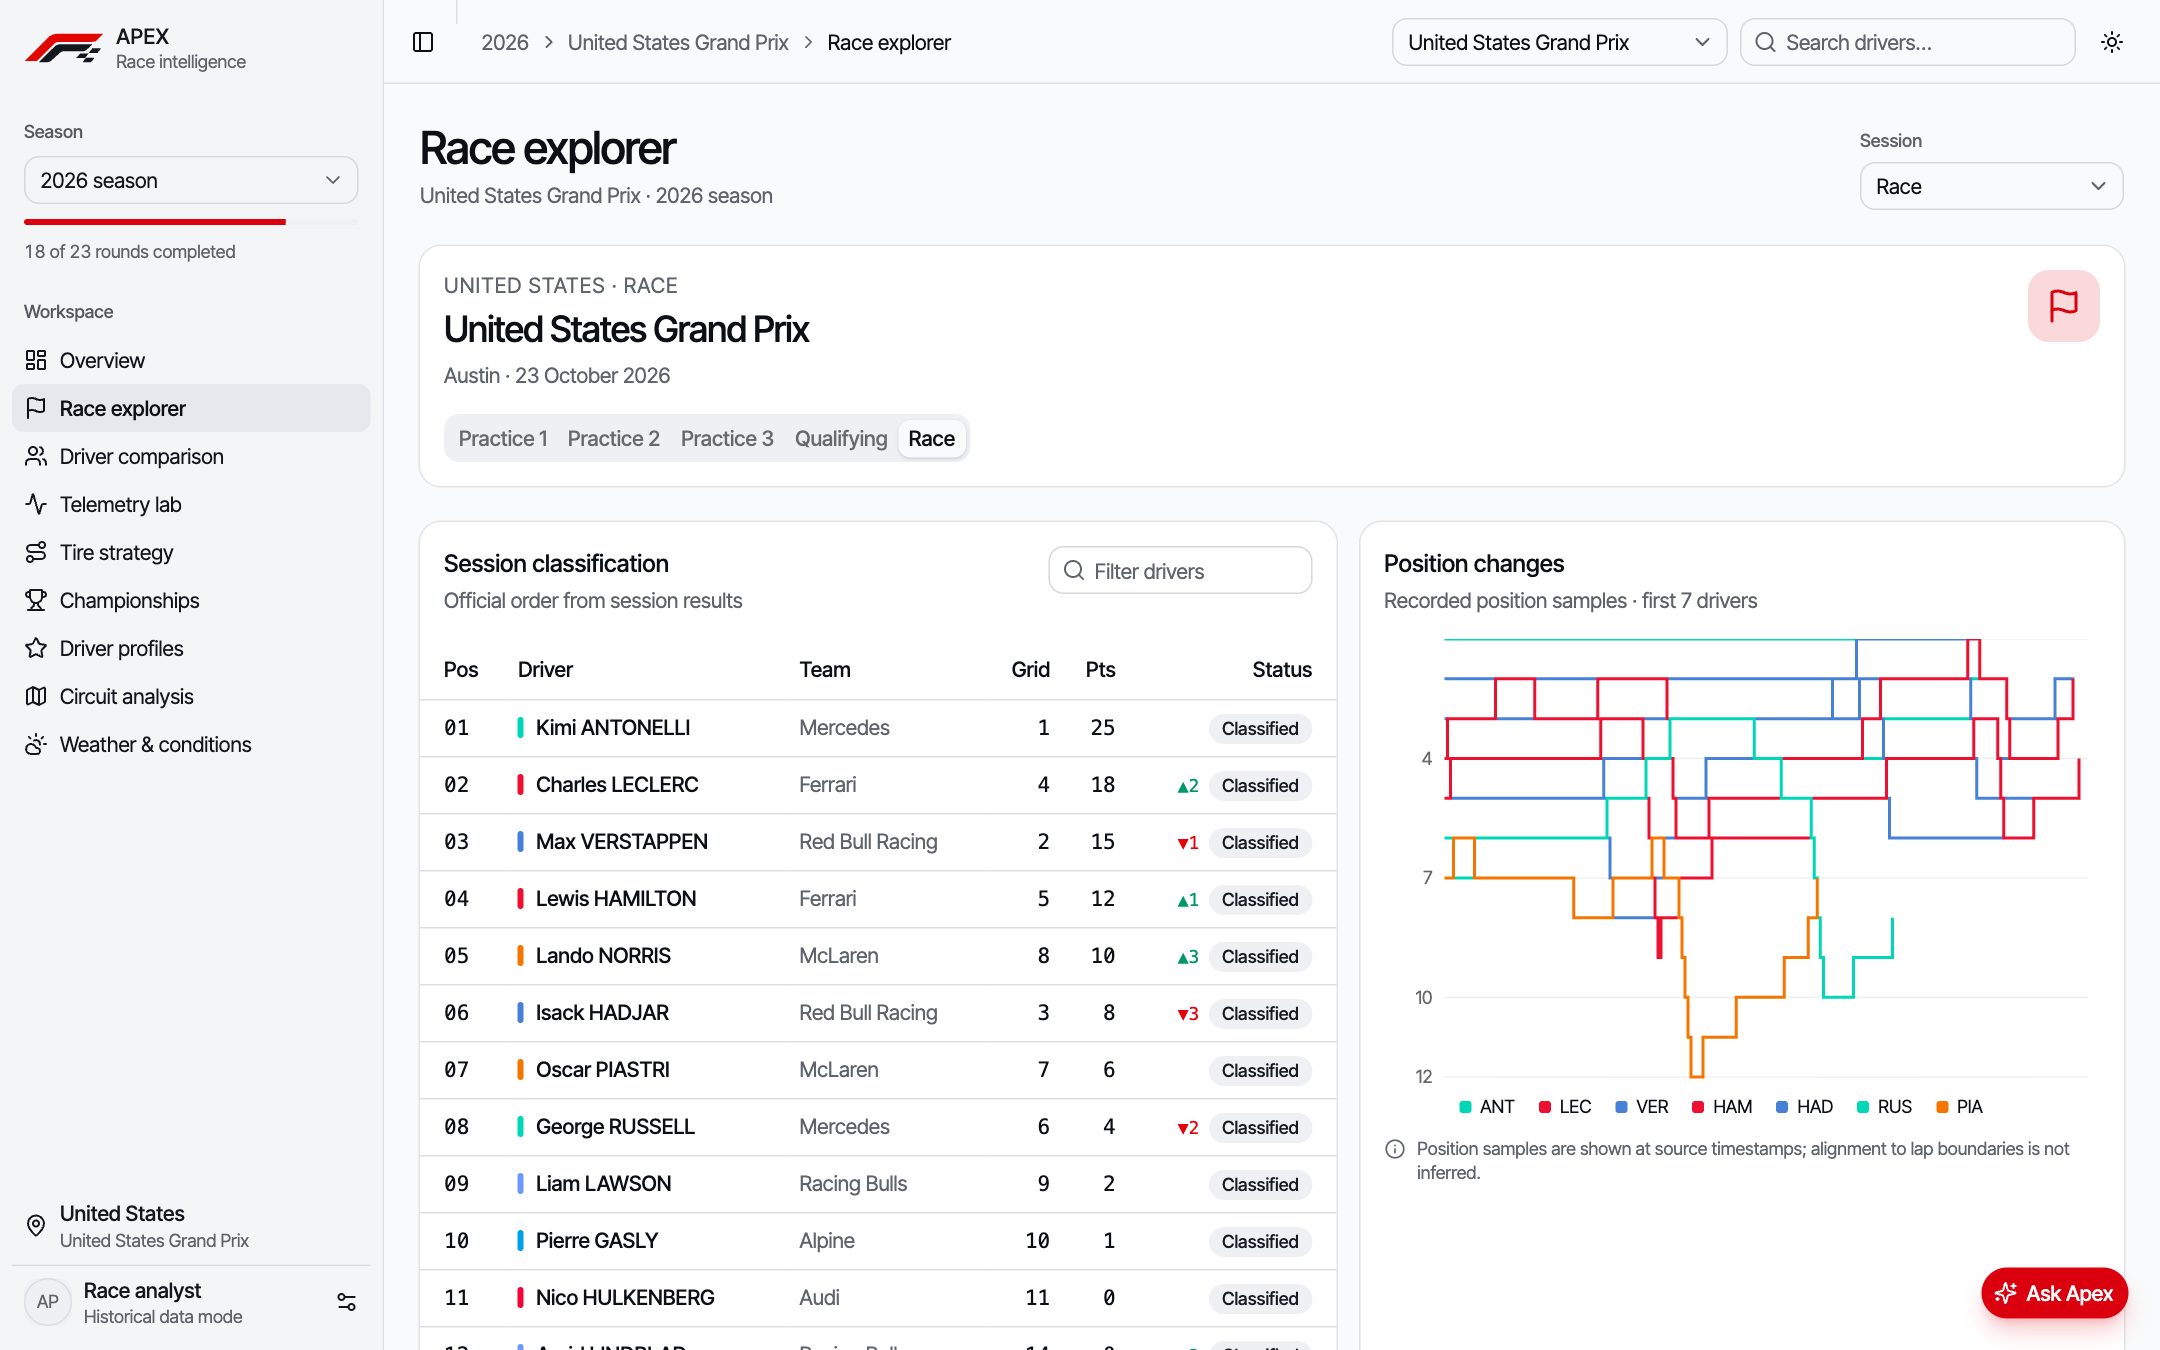
Race explorer
Session classification, position changes and lap-by-lap progress for every Grand Prix.
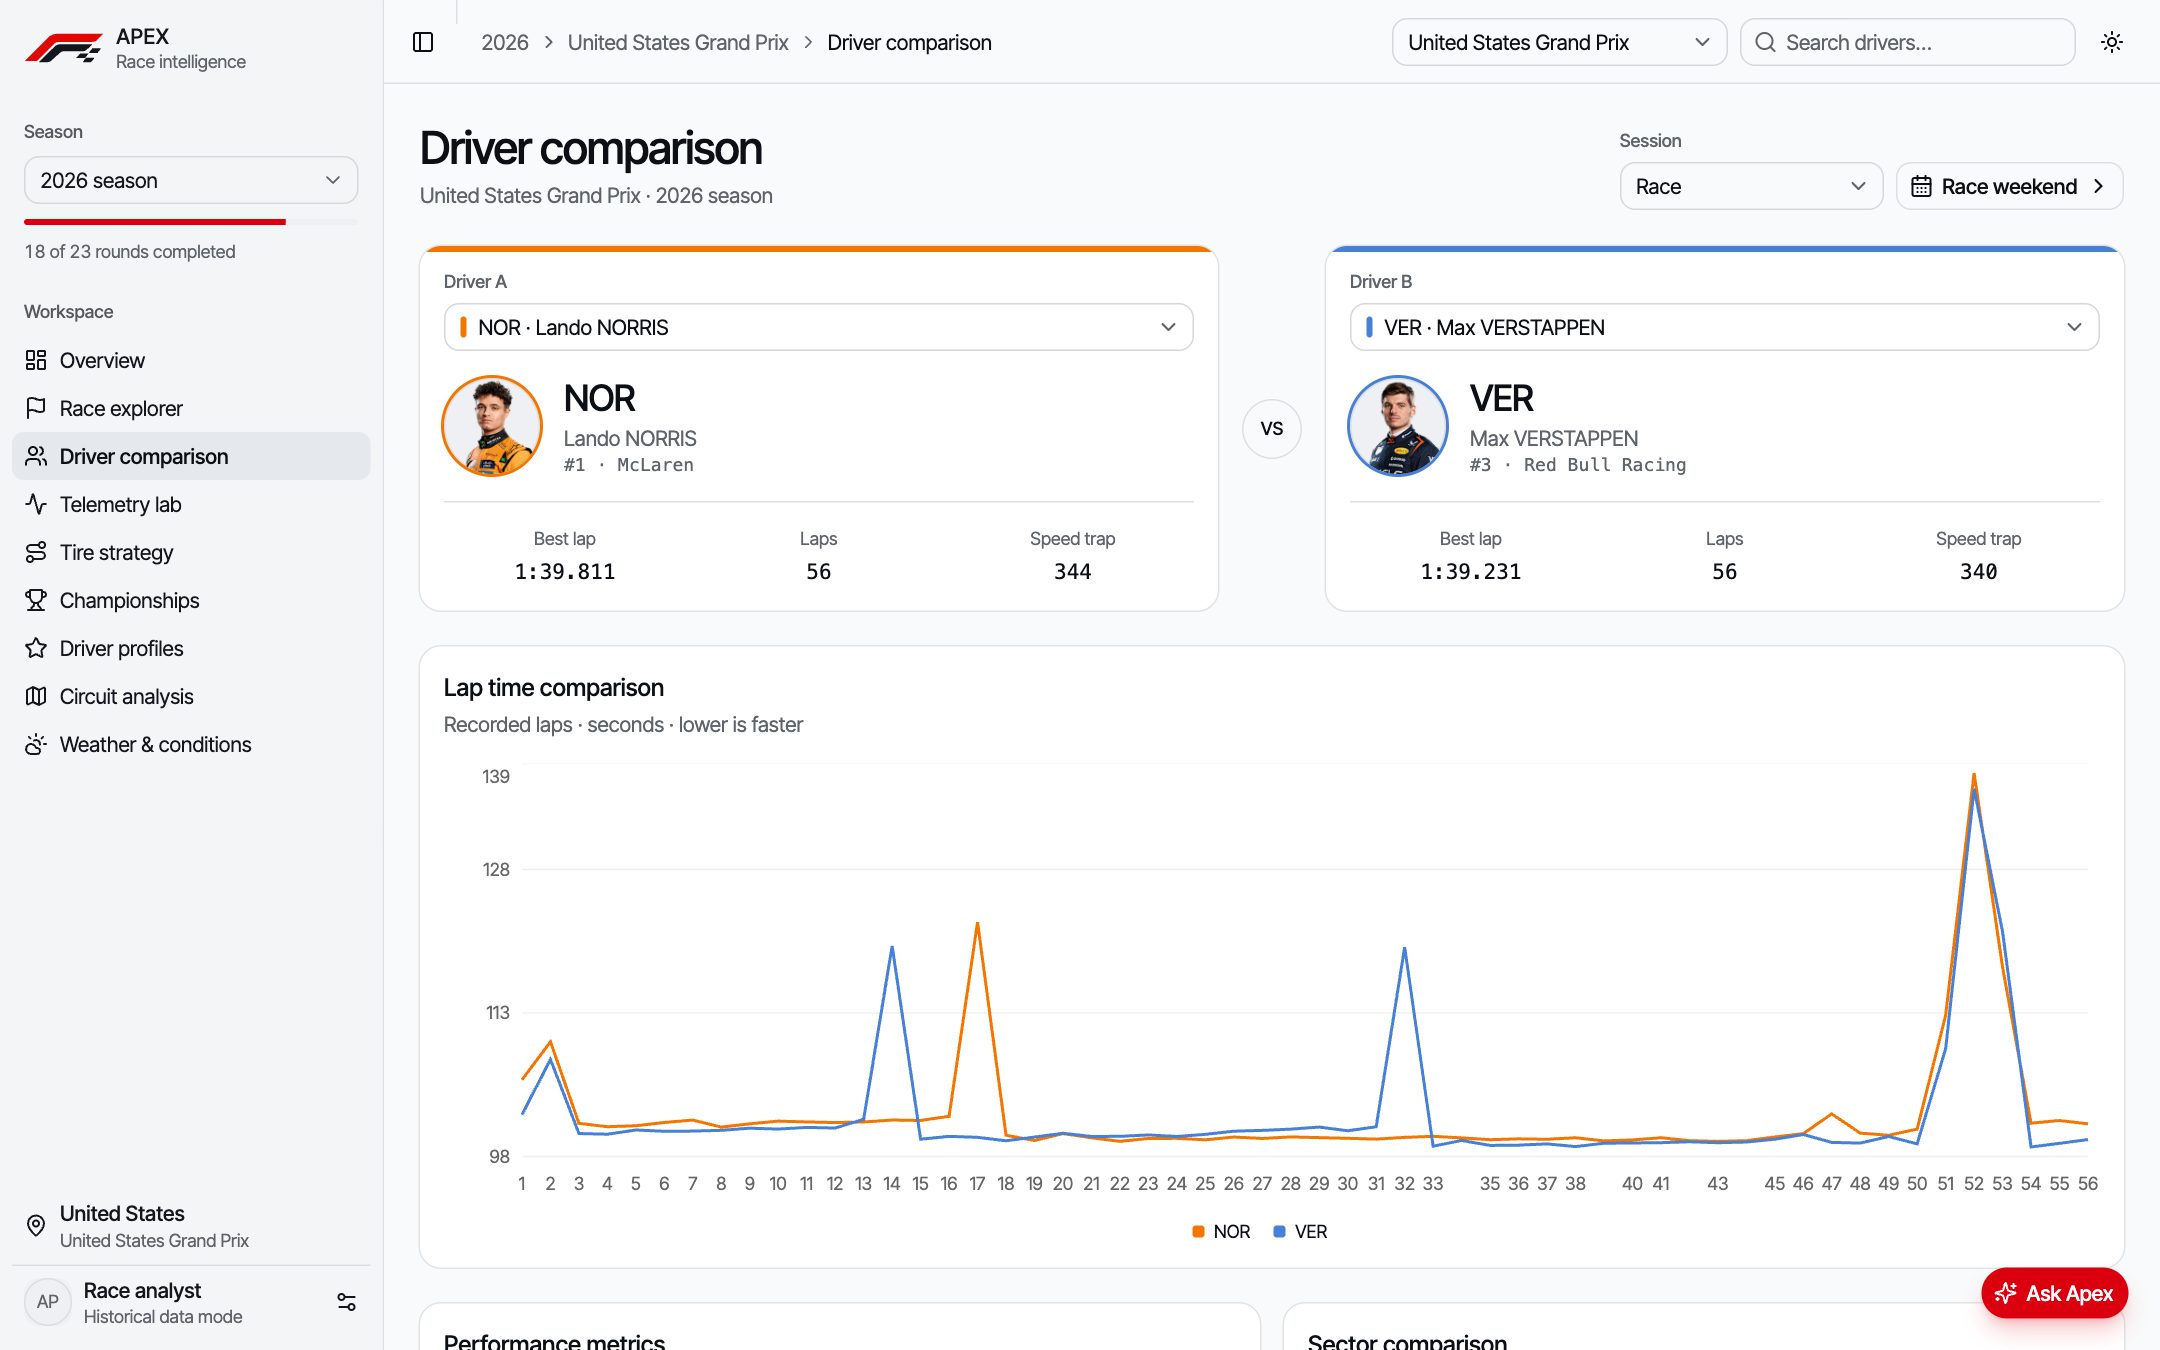
Driver comparison
Head-to-head lap times and performance metrics for any two drivers.
Ask Apex
An AI race analyst that answers questions about the data — key kept server-side, usage rate-limited.
Responsive
Built for any screen
The whole dashboard collapses into a single-column layout with a slide-out sidebar, so race weekends can be followed from a phone.
Slide-out sidebar replaces the desktop navigation
Cards stack into a single readable column
Ask Apex stays one tap away
In the data
The 2025 season, straight from OpenF1.
Two views APEX is built around, recreated here with real data pulled from the OpenF1 API. Hover or tap for exact values.
Championship
Verstappen was 104 points behind after Zandvoort, and lost the title by 2.
Cumulative drivers’ points after each Grand Prix, sprint points included. Switch to “Gap to leader” to see the lead change hands: Piastri led from round 5 to round 19, Norris took over in Mexico City. Click a name to hide it.
Source: OpenF1 API · championship_drivers, all 24 race sessions of 2025.
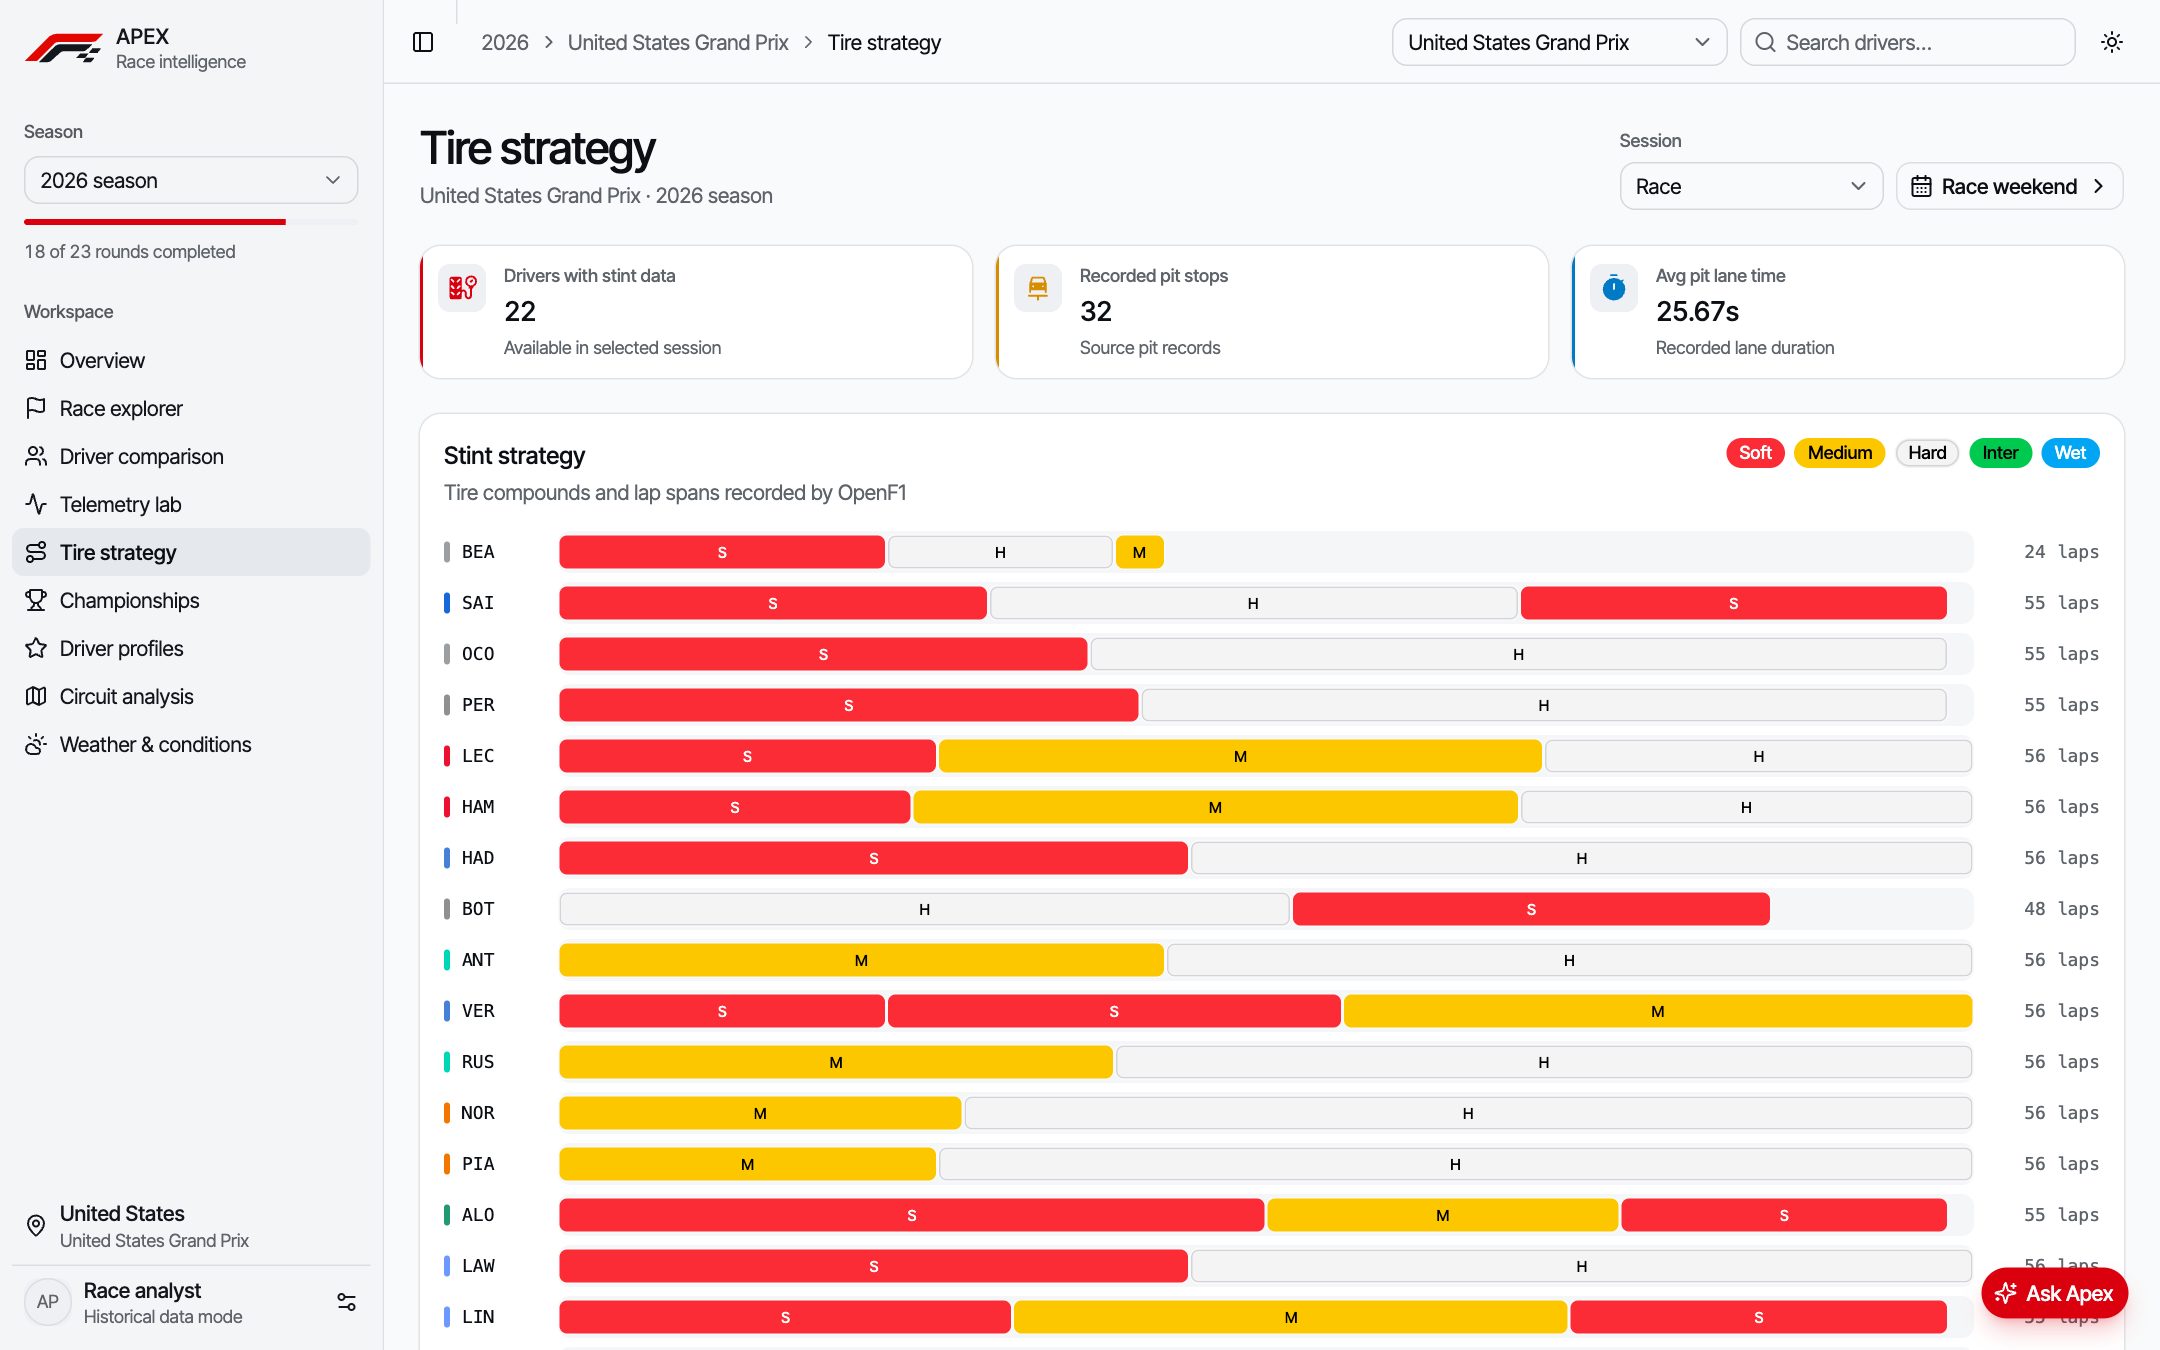
Tire strategy
Abu Dhabi 2025: one race, three different plans at the front.
Each bar is a stint, split at every pit stop. Verstappen won on a one-stop, Piastri ran the reverse strategy with 41 laps on hards, and Norris pitted twice. Third place was enough for the title.
Source: OpenF1 API · stints and session_result, Abu Dhabi Grand Prix 2025, top 10 finishers.
Screens
A closer look at the product.
Race explorer with classification and position changesDriver comparison — lap times side by sideTire strategy — every stint and compound across the raceChampionship standings with points gaps
Working with real sports data is mostly about deciding what not to load. Designing around windowed, downsampled requests made the dashboard fast — and taught me to treat API limits as a design constraint, not an afterthought.
 ← All projects