AI analysis you can actually trust
- Language models are good at explaining data but can invent numbers.
- Messy real-world files: mixed types, inconsistent categories, missing values.
- Results had to be clear to people who don’t read raw statistics.
 ← All projects
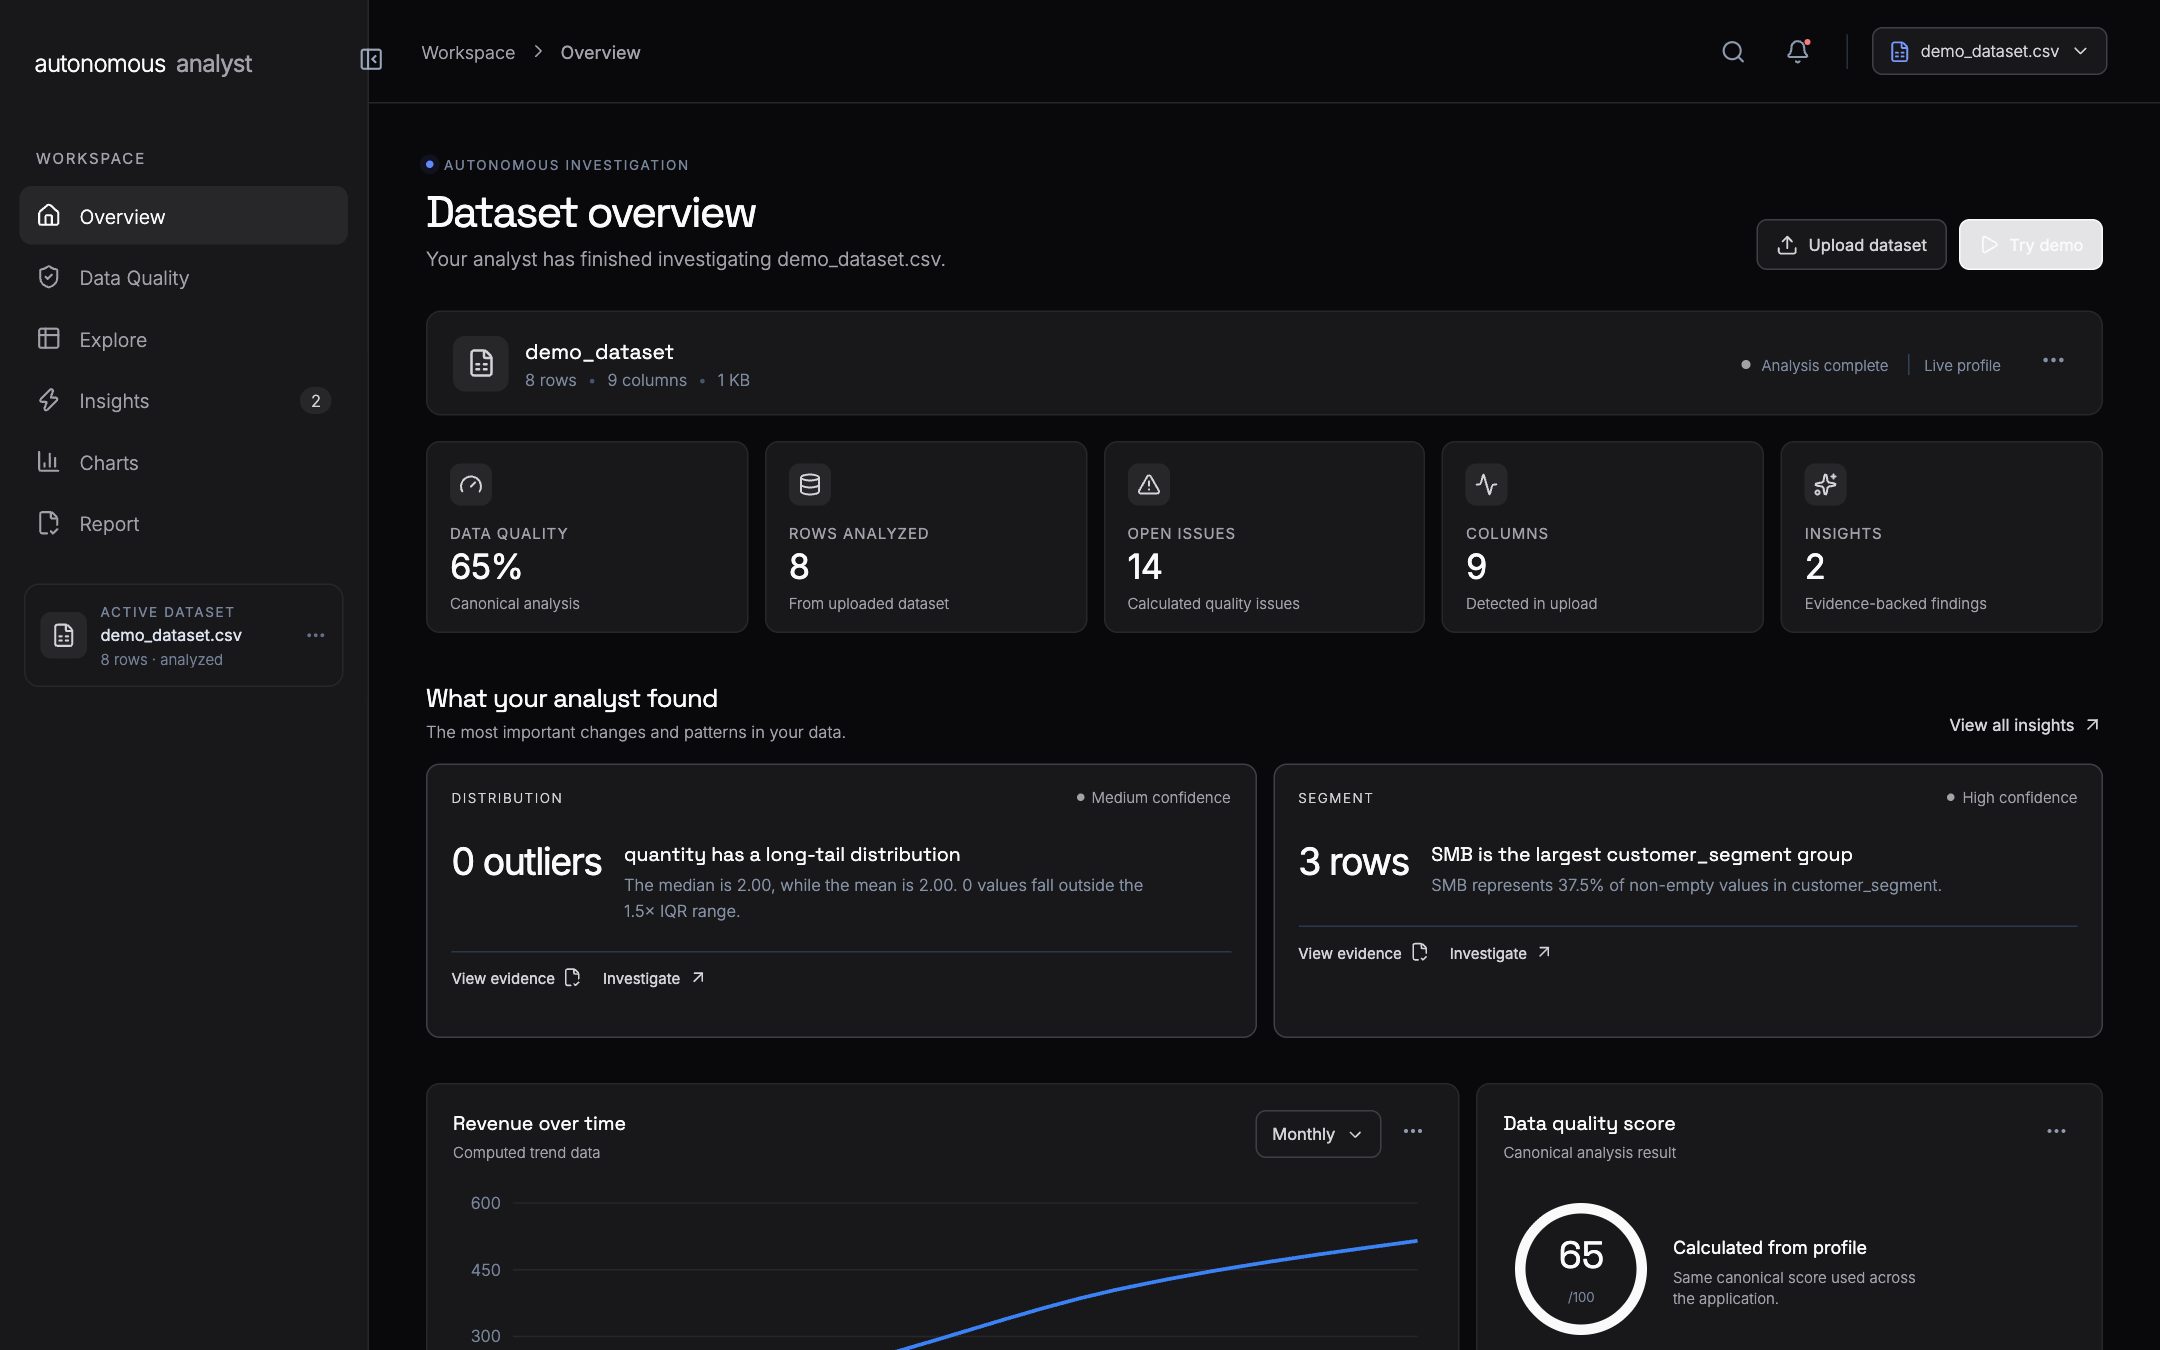
An AI-assisted analytics workspace: upload a dataset and get a data-quality report, findings and charts — backed by a deterministic profiling engine.
Before any real analysis, every dataset needs the same groundwork: checking types, missing values, duplicates, outliers and distributions. Autonomous Data Analyst automates that first pass and presents it as a readable workspace — overview, data quality, insights and charts.
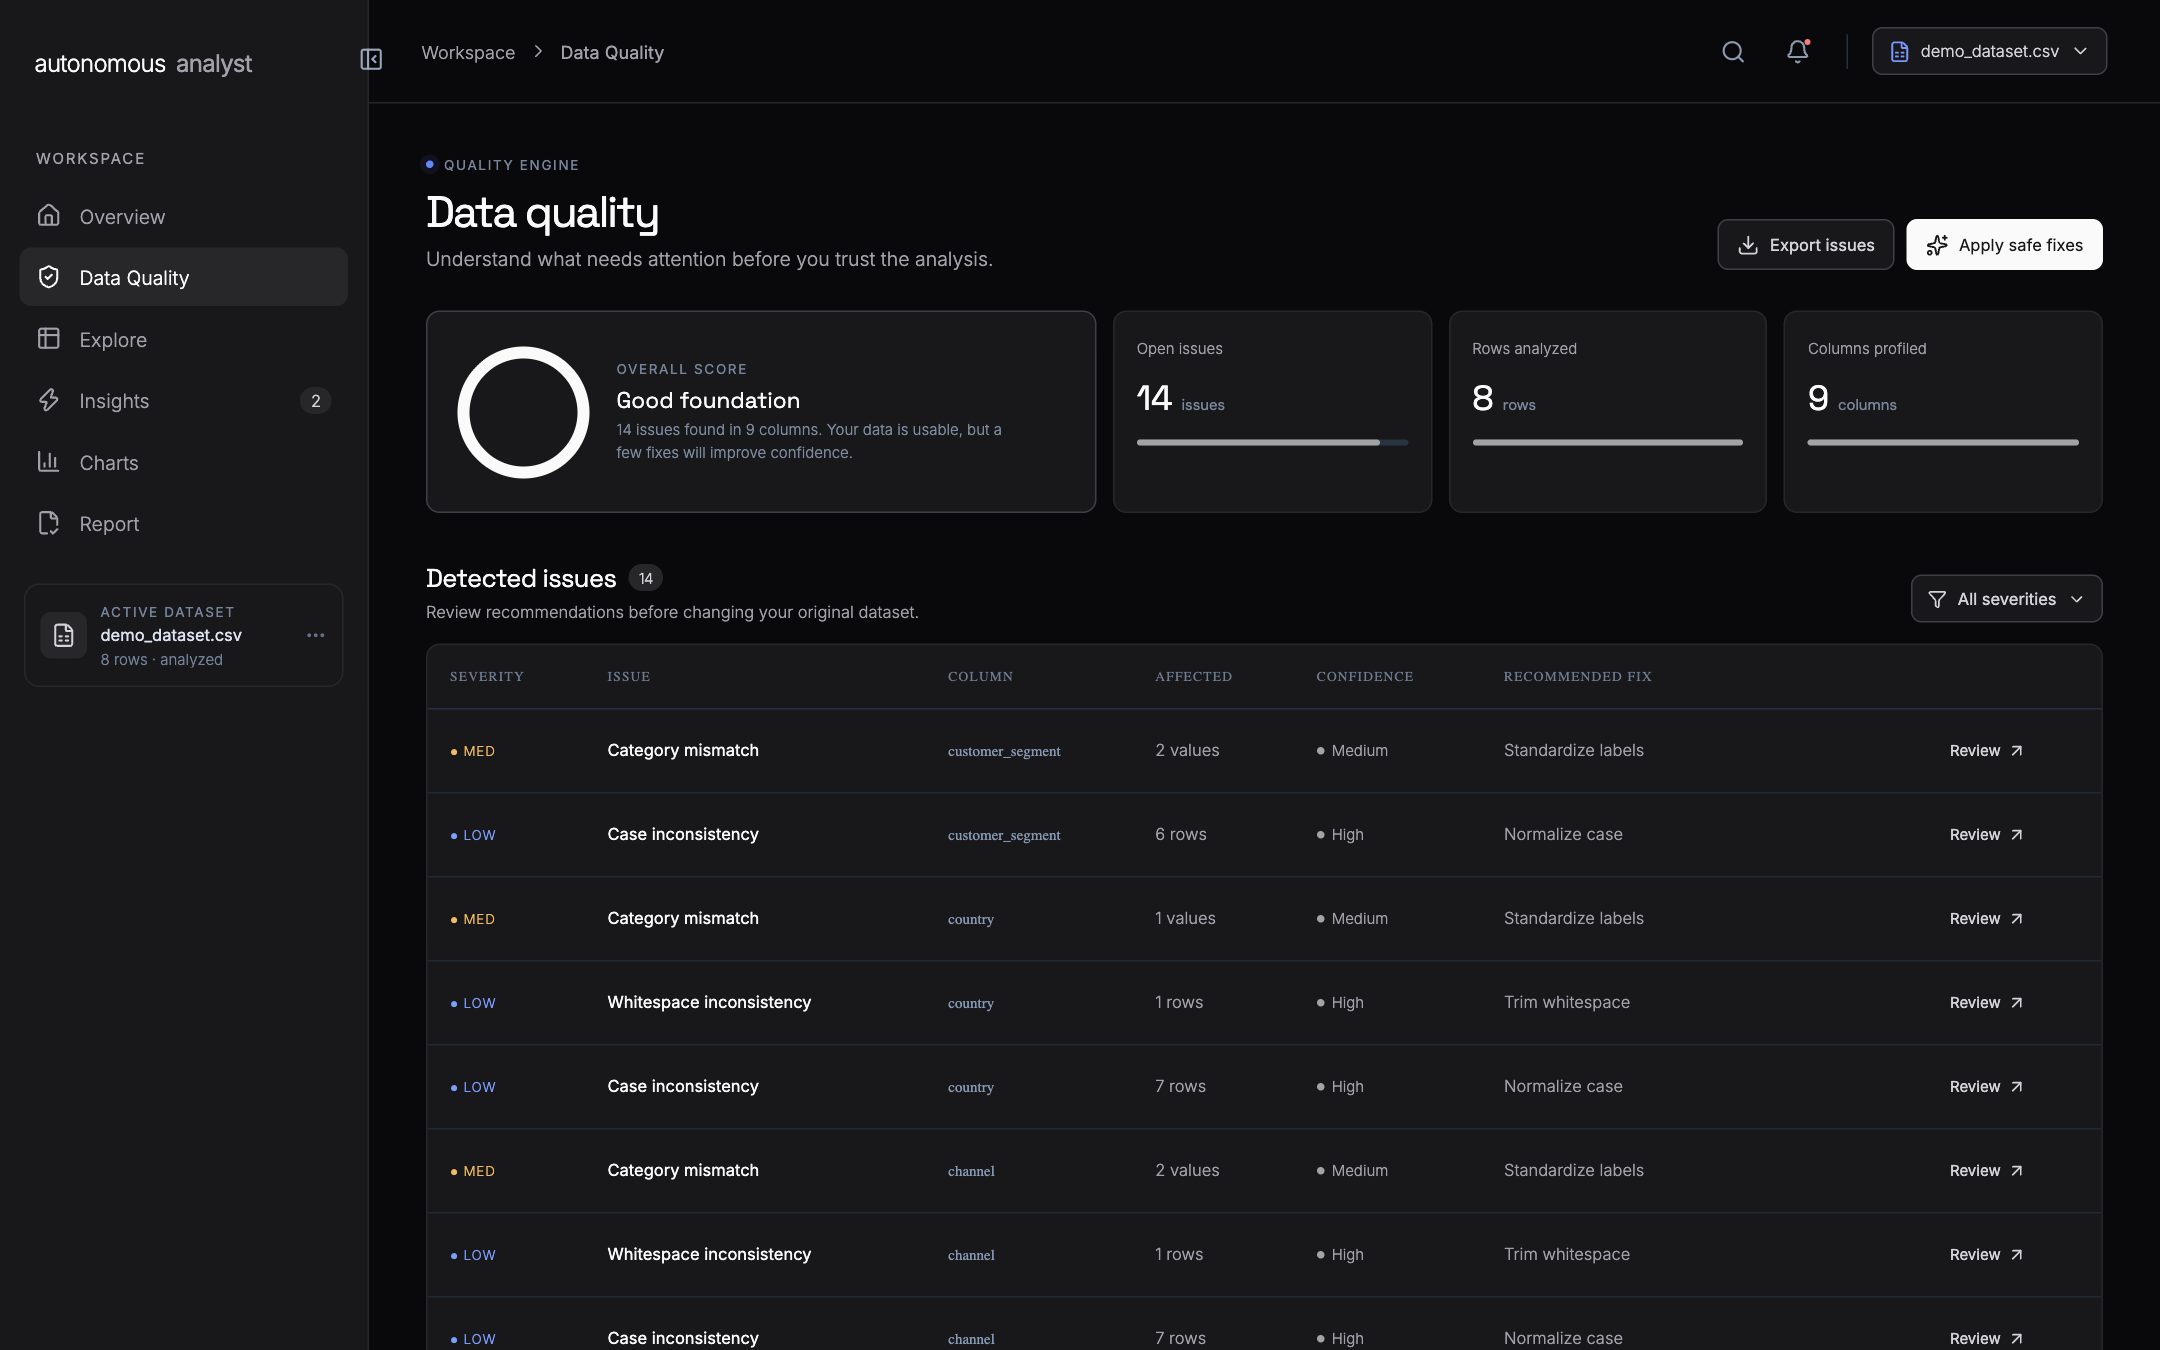
A canonical quality score with detected issues — missing values, inconsistencies, outliers.
Evidence-backed findings, each linked to the columns and values behind it.
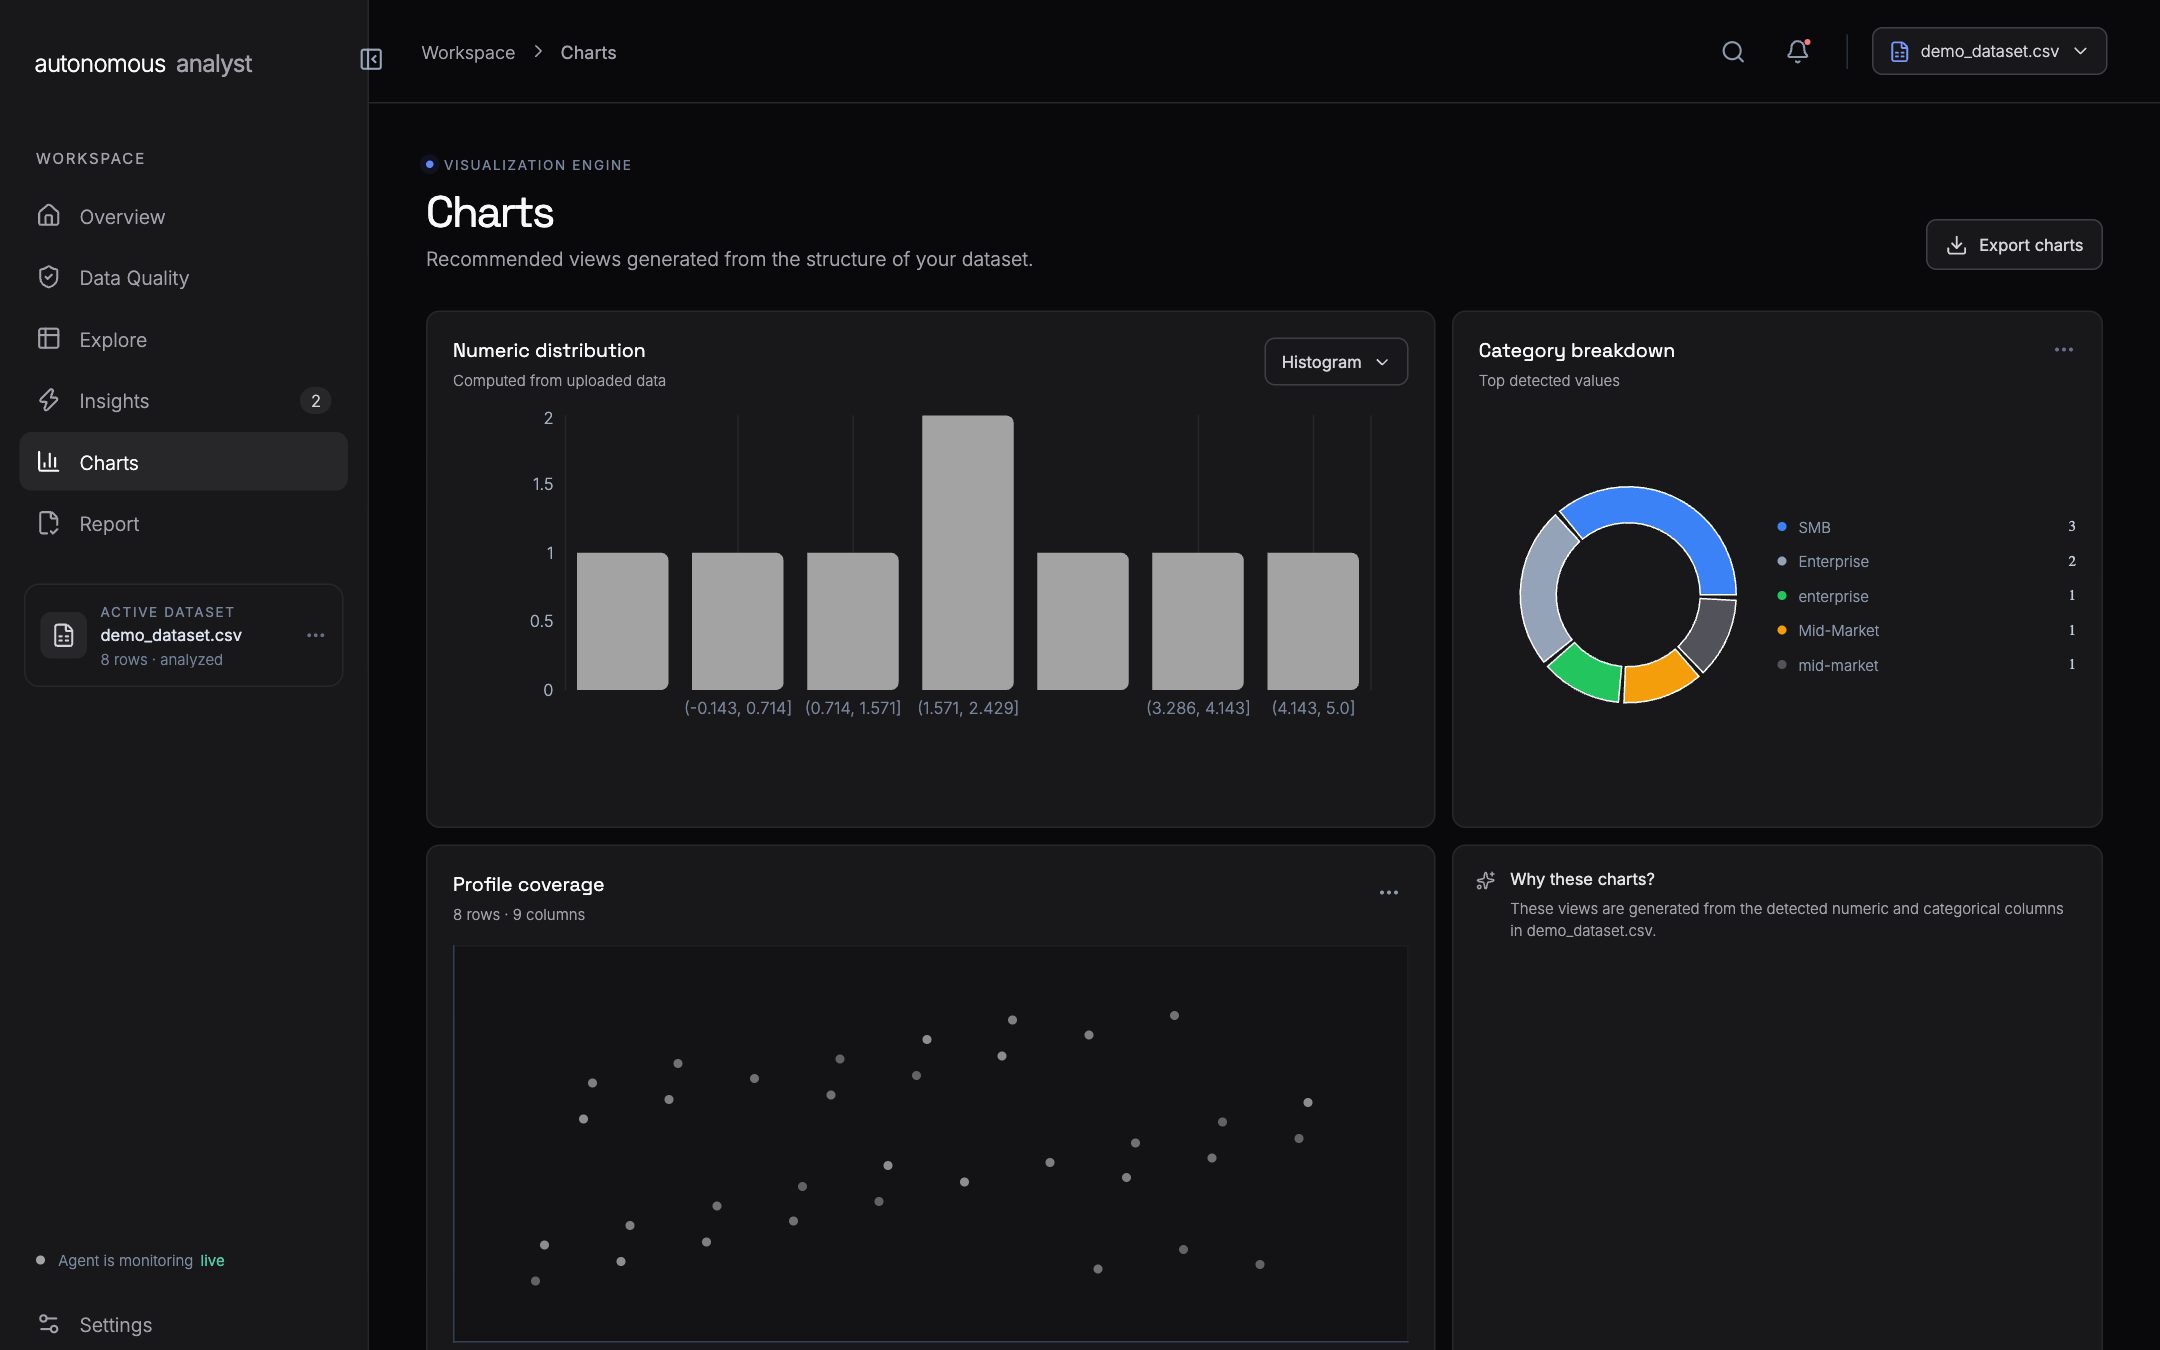
Distributions and category breakdowns chosen automatically from the dataset’s structure.
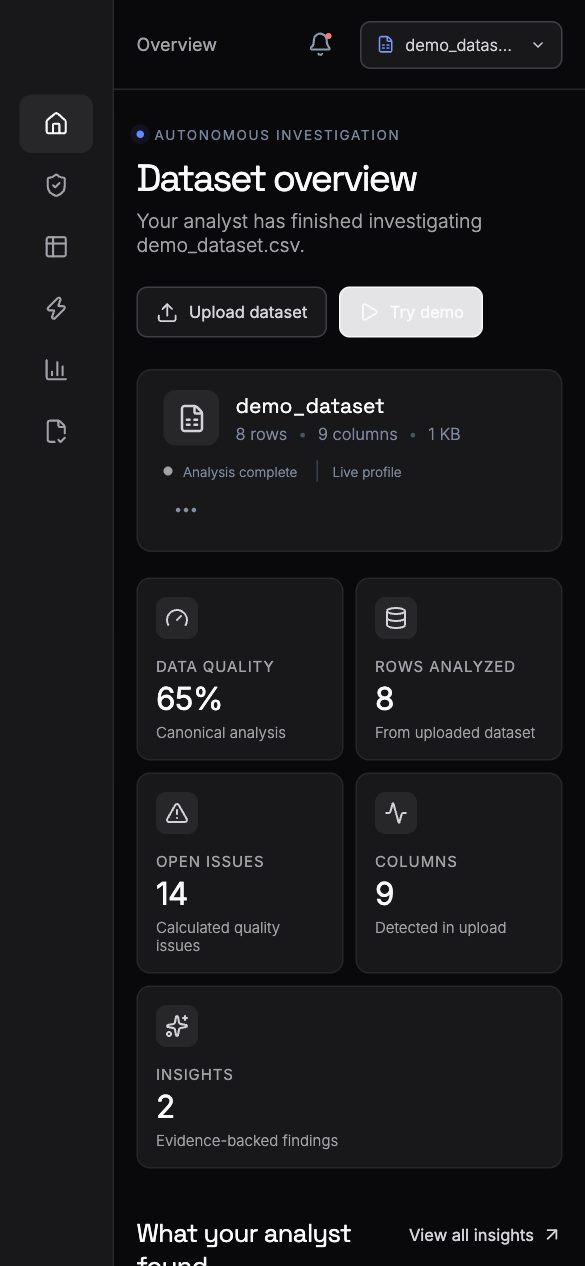
The workspace adapts to smaller screens with a collapsible sidebar, so reports can be checked on the go.
Both charts use the real output of the app’s FastAPI profiler, run on the deliberately messy demo dataset that ships with it.
No missing values and no duplicate rows, but 14 issues: invalid quantities and percentages, an email column flagged as PII, and labels that mean the same thing written differently.
Source: profile_frame() in backend/main.py, run on the /api/demo dataset.
“Enterprise” and “enterprise” count as different groups until the labels are standardised. Toggle to see the breakdown after cleaning.
Source: category_breakdown from the profiler output; the cleaned view merges case variants.

Separating “compute” from “explain” was the key decision. Keeping every number deterministic and only using AI-style summaries on top of it made the tool far more trustworthy.
A smart dual-plant terrarium and its live dashboard — sensors, pumps, a fan and a grow light, built as a group project for the Interactive Systems course.